Heritage building exterior
Point cloud scan
3D model view

Heritage Building Documentation

Comprehensive documentation of a 19th-century heritage building using terrestrial laser scanning and drone photogrammetry. The point cloud data was processed and converted into a detailed Revit model for conservation planning and structural analysis.

The final BIM model includes accurate geometry, material specifications, and condition assessment data. This enables the conservation team to plan interventions while preserving historical authenticity.

Revit ReCap AutoCAD
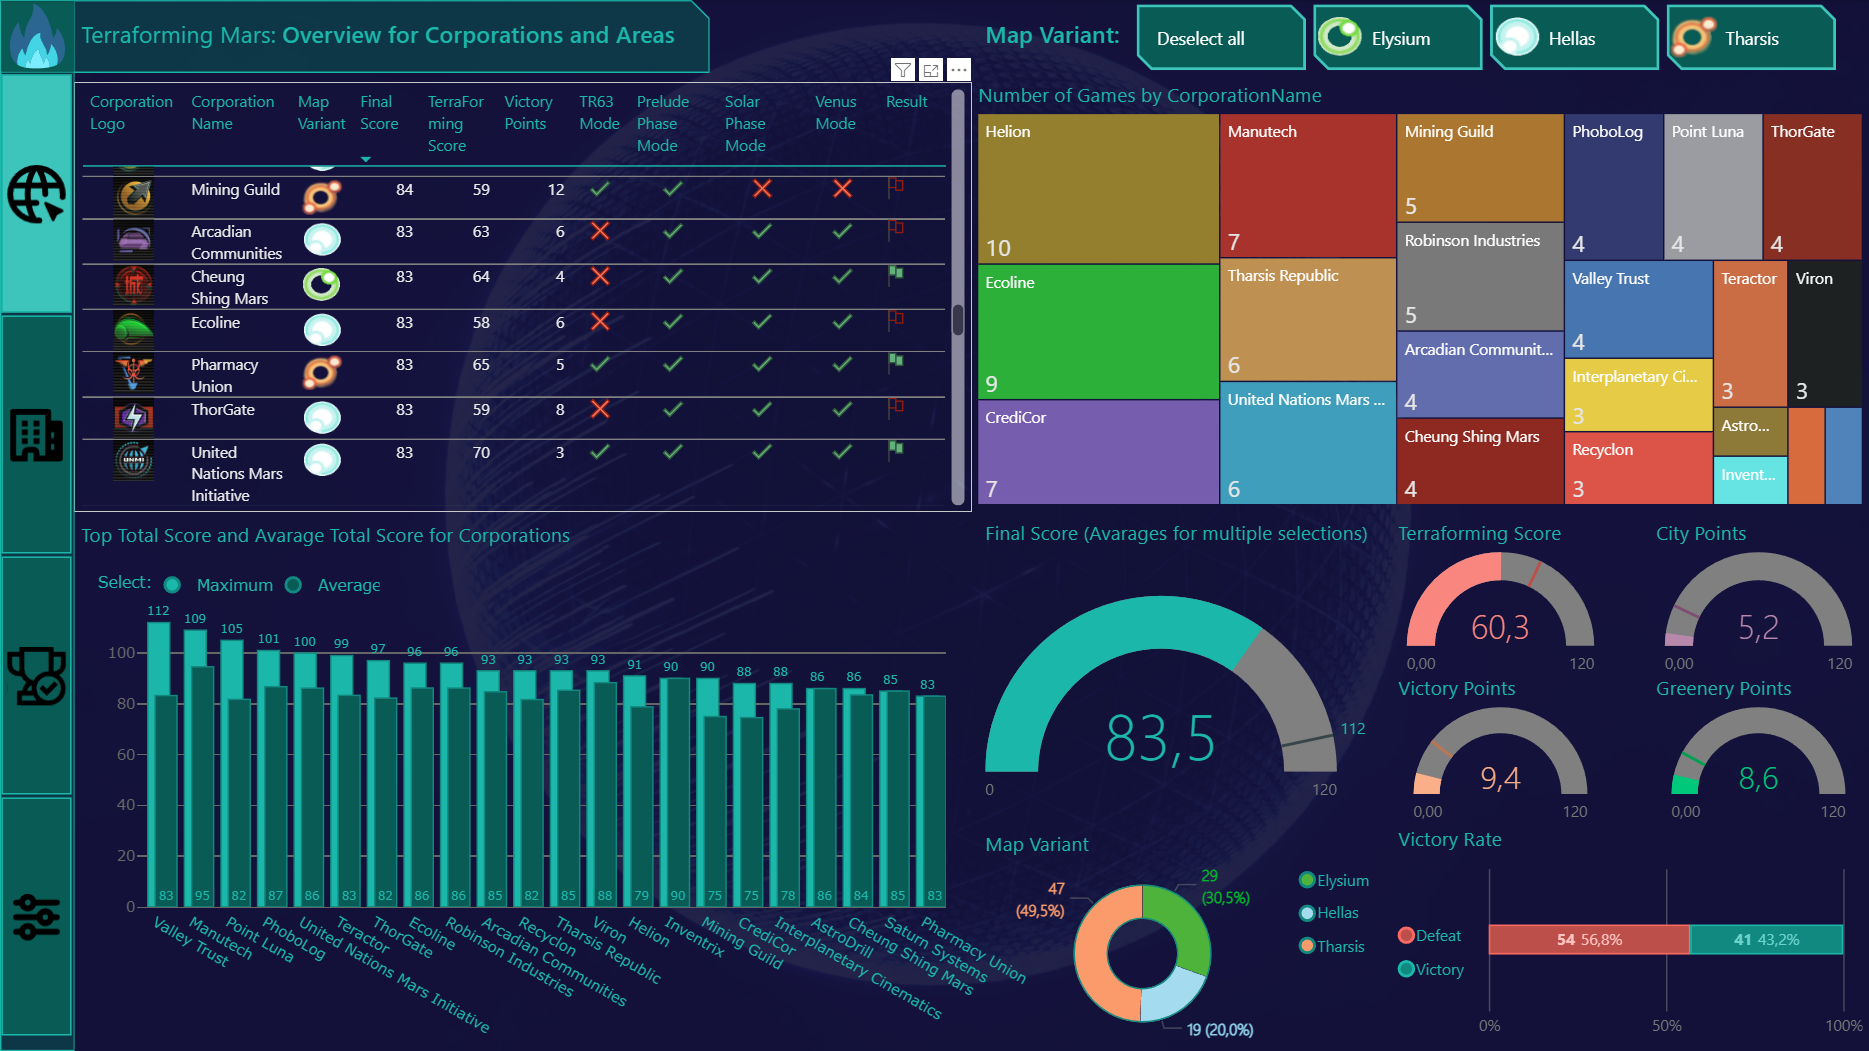
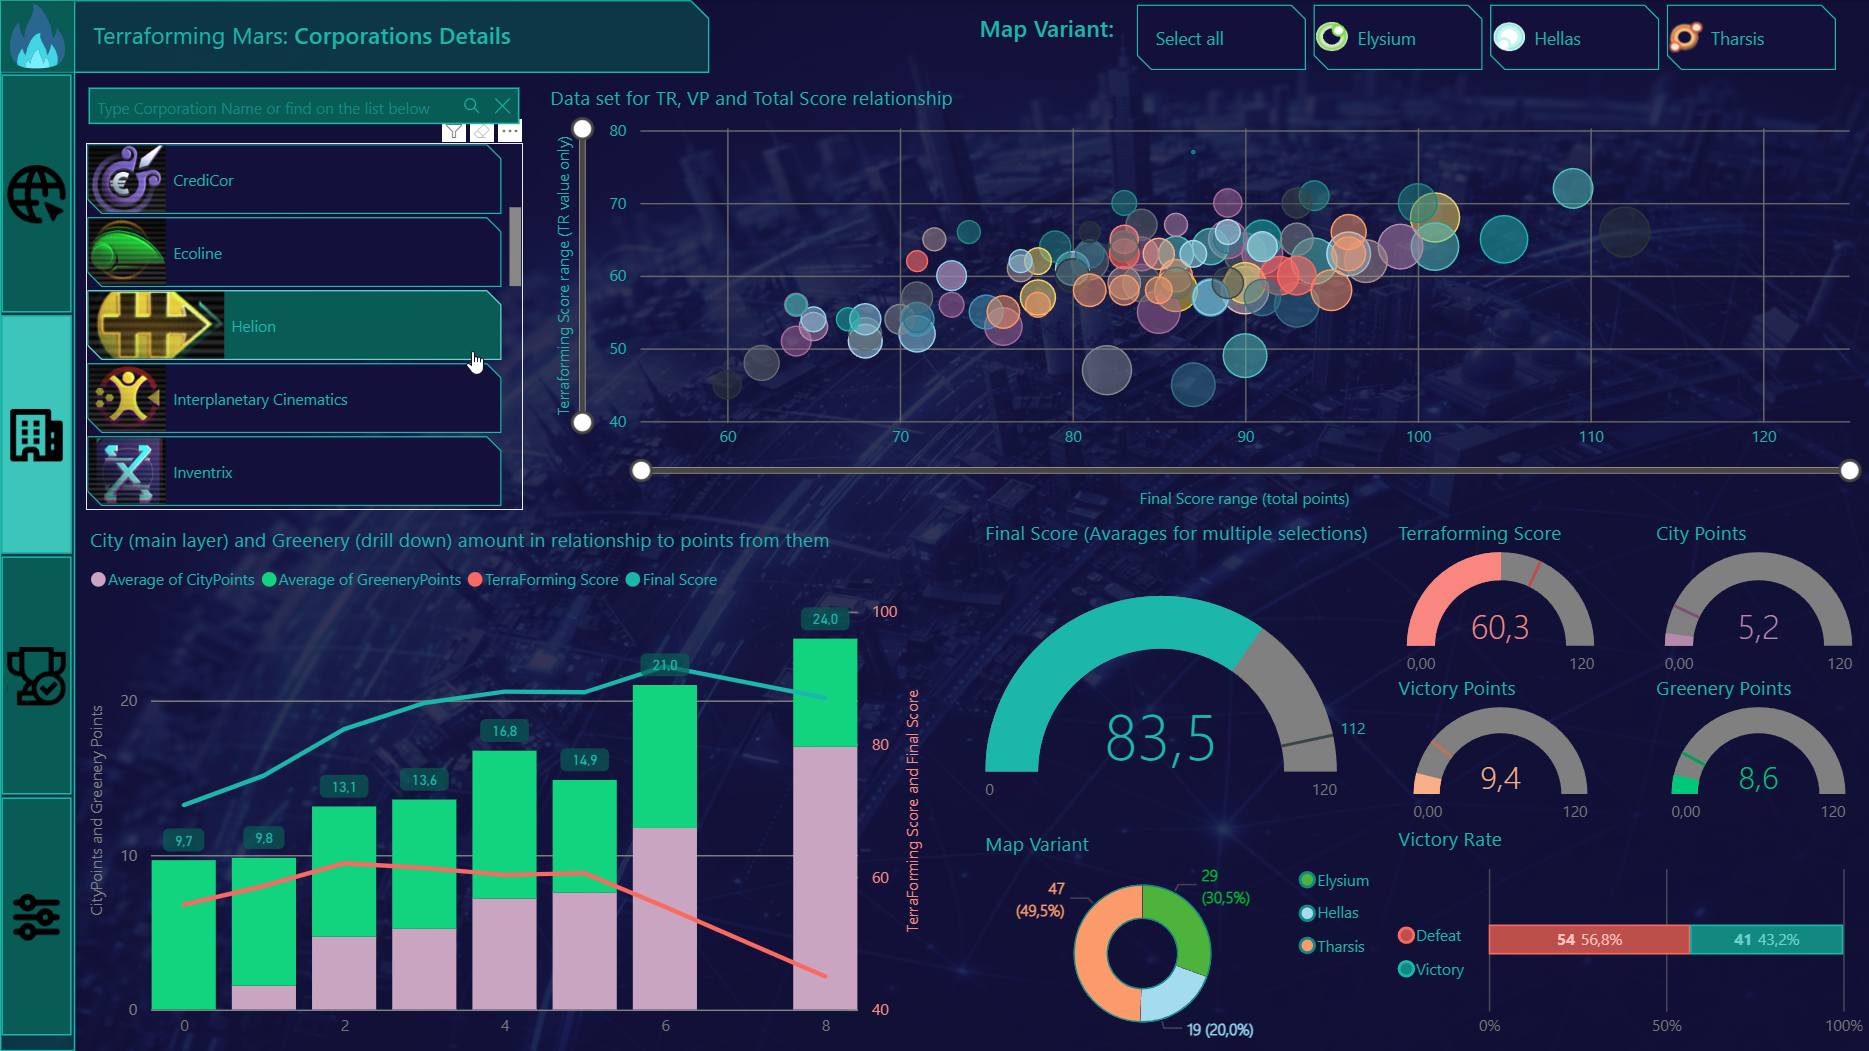
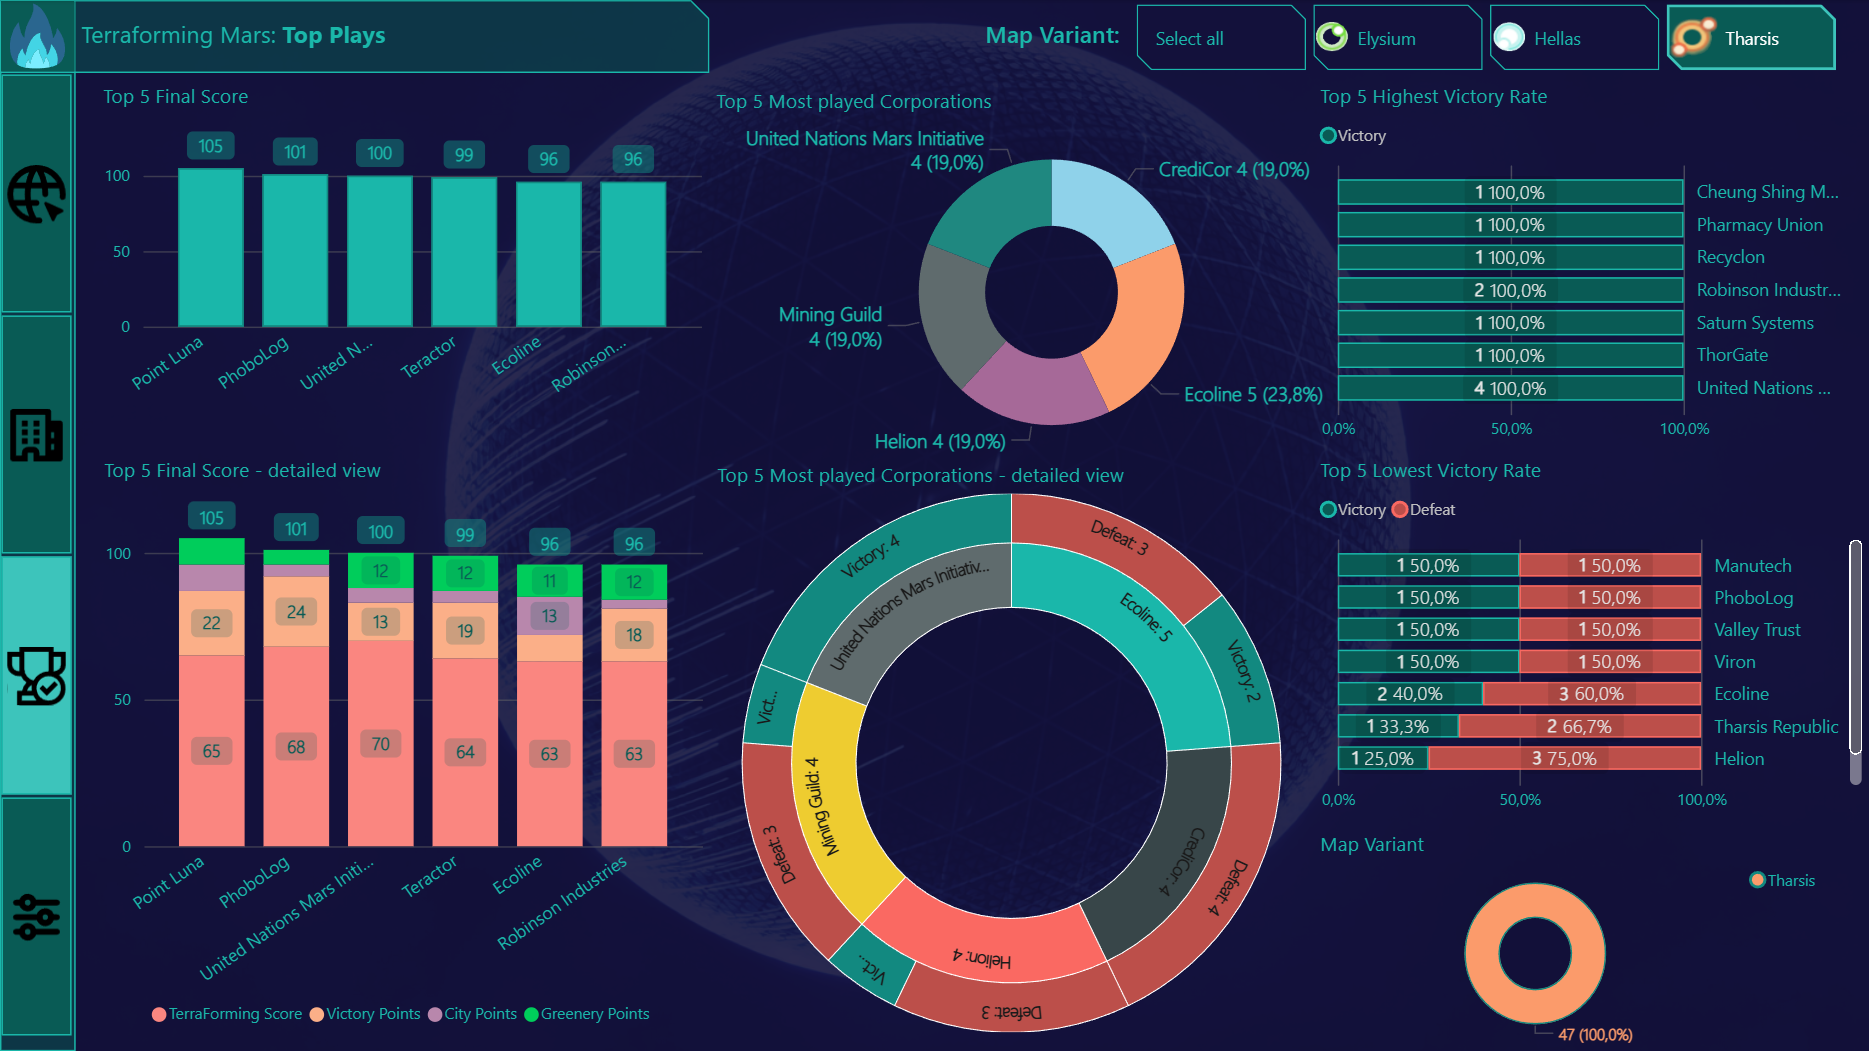
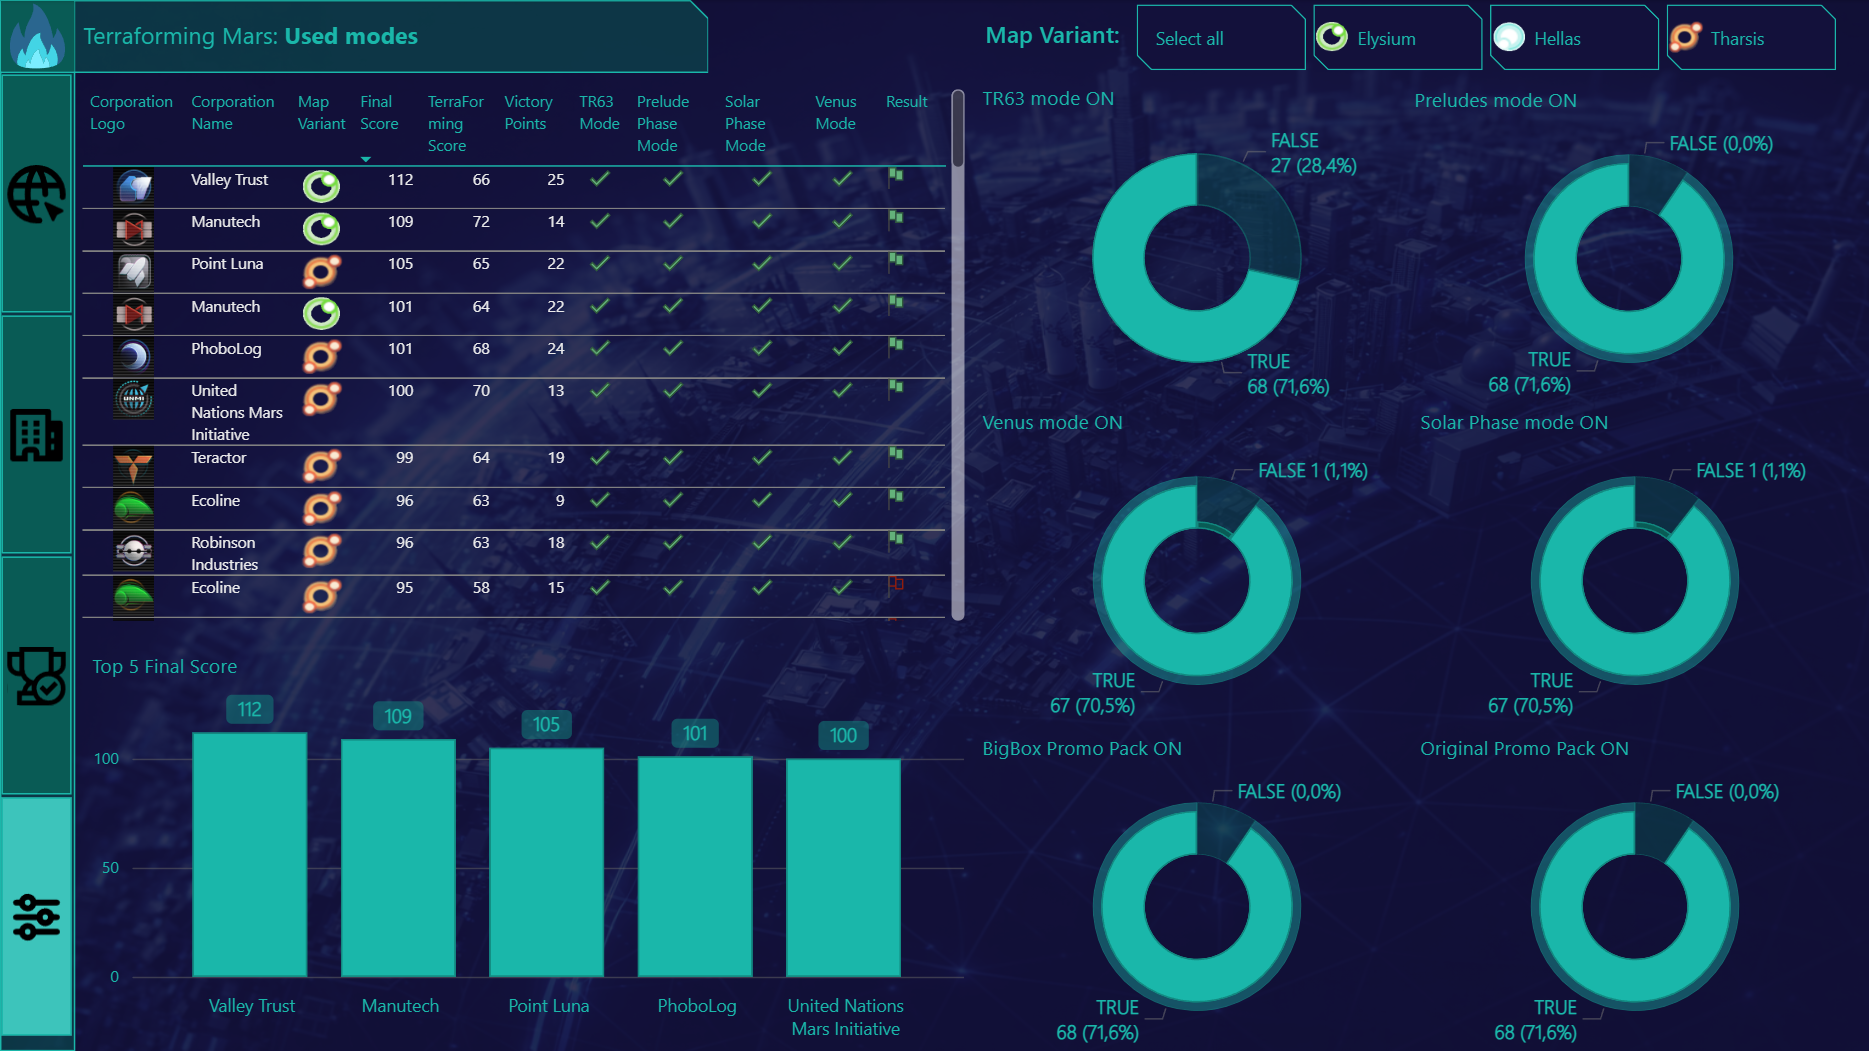
Terraforming Mars dashboard overview

Power BI Board Game Strategy Analysis

Terraforming Mars is definitely my favorite board game. When I discovered there is a .json game log I couldn't resist to find out which strategy brought me to the best results. One file, repetitive data structure and a question: "how can I beat my last record".

Cool thing about corporations' color pick for dashboard it is a fact they are not random or manually selected. With Python and GPT's help, script for brand RGB color recognition was created. It analyze main part of .png logo file, extract's pixels RGB, define dominant chroma and calculate the most fitting one, getting rid of noise and irrelevant background.

Final touch - application-like interface with menu bar, search bar and buttons to navigate across dashboards.

Power BI PowerShell Python
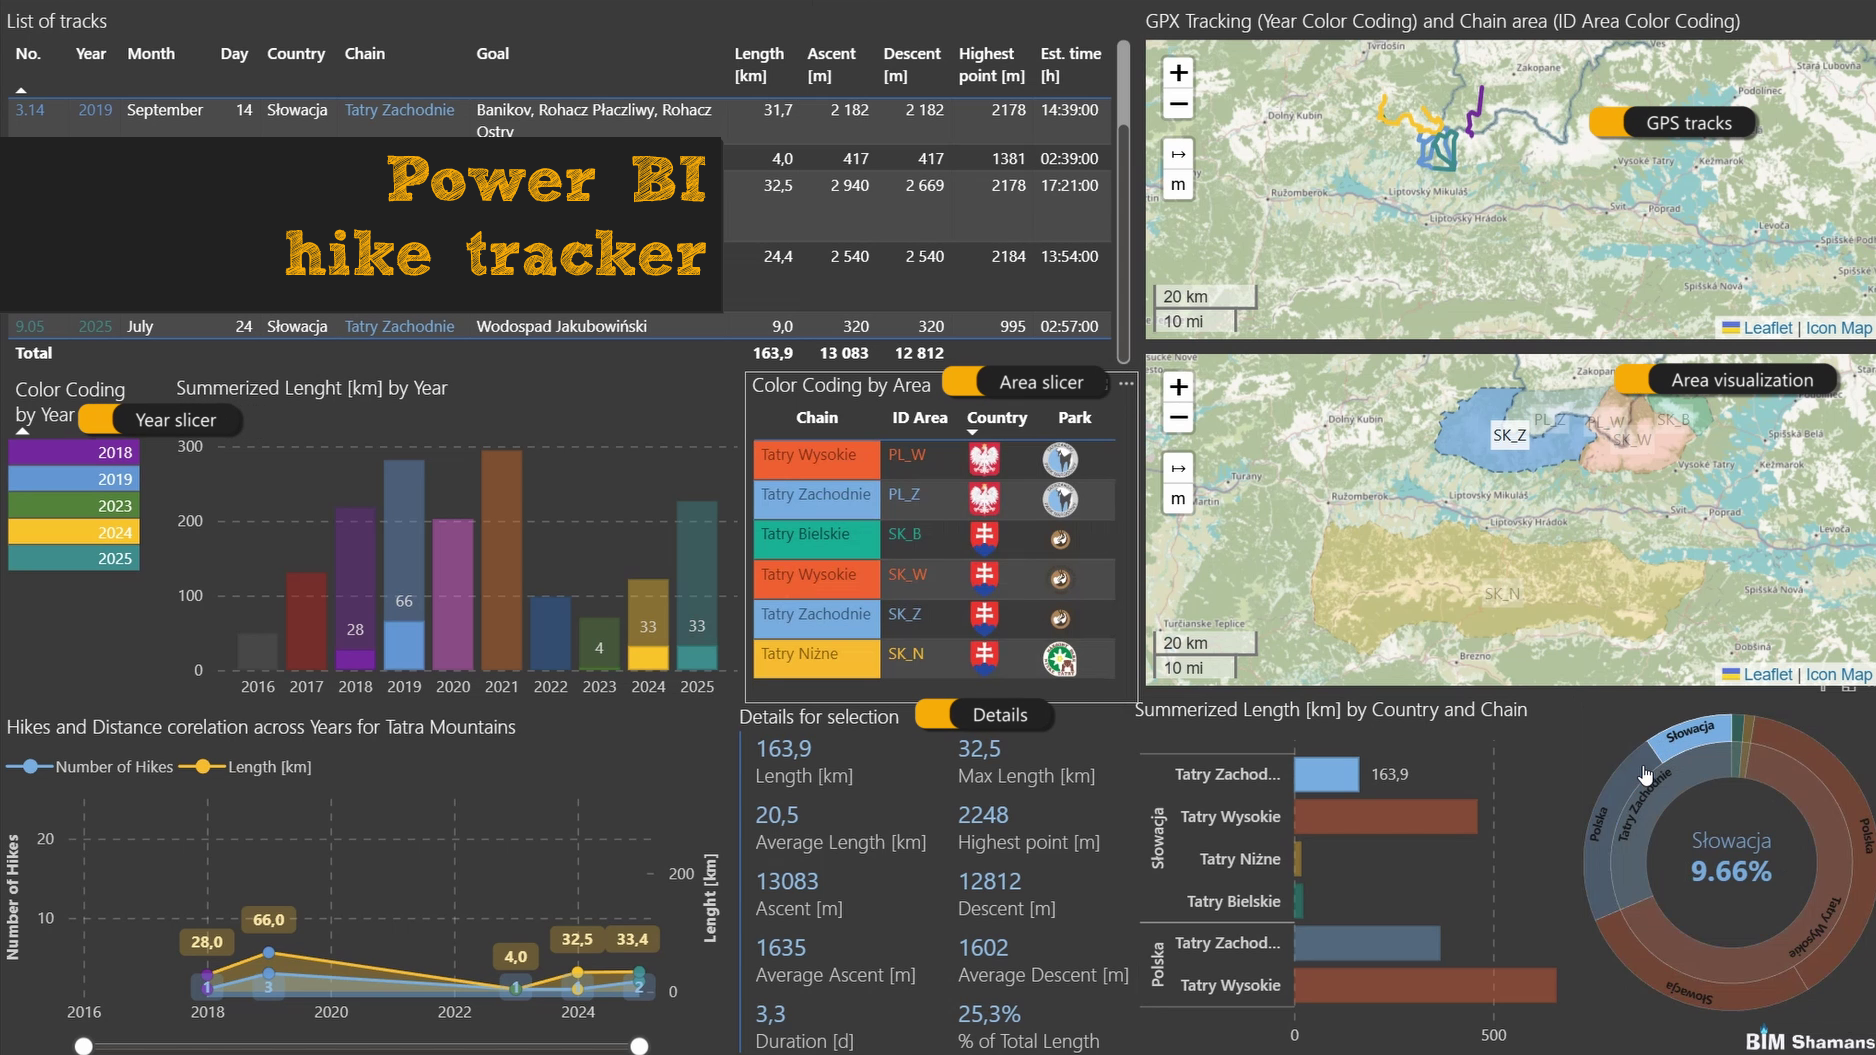
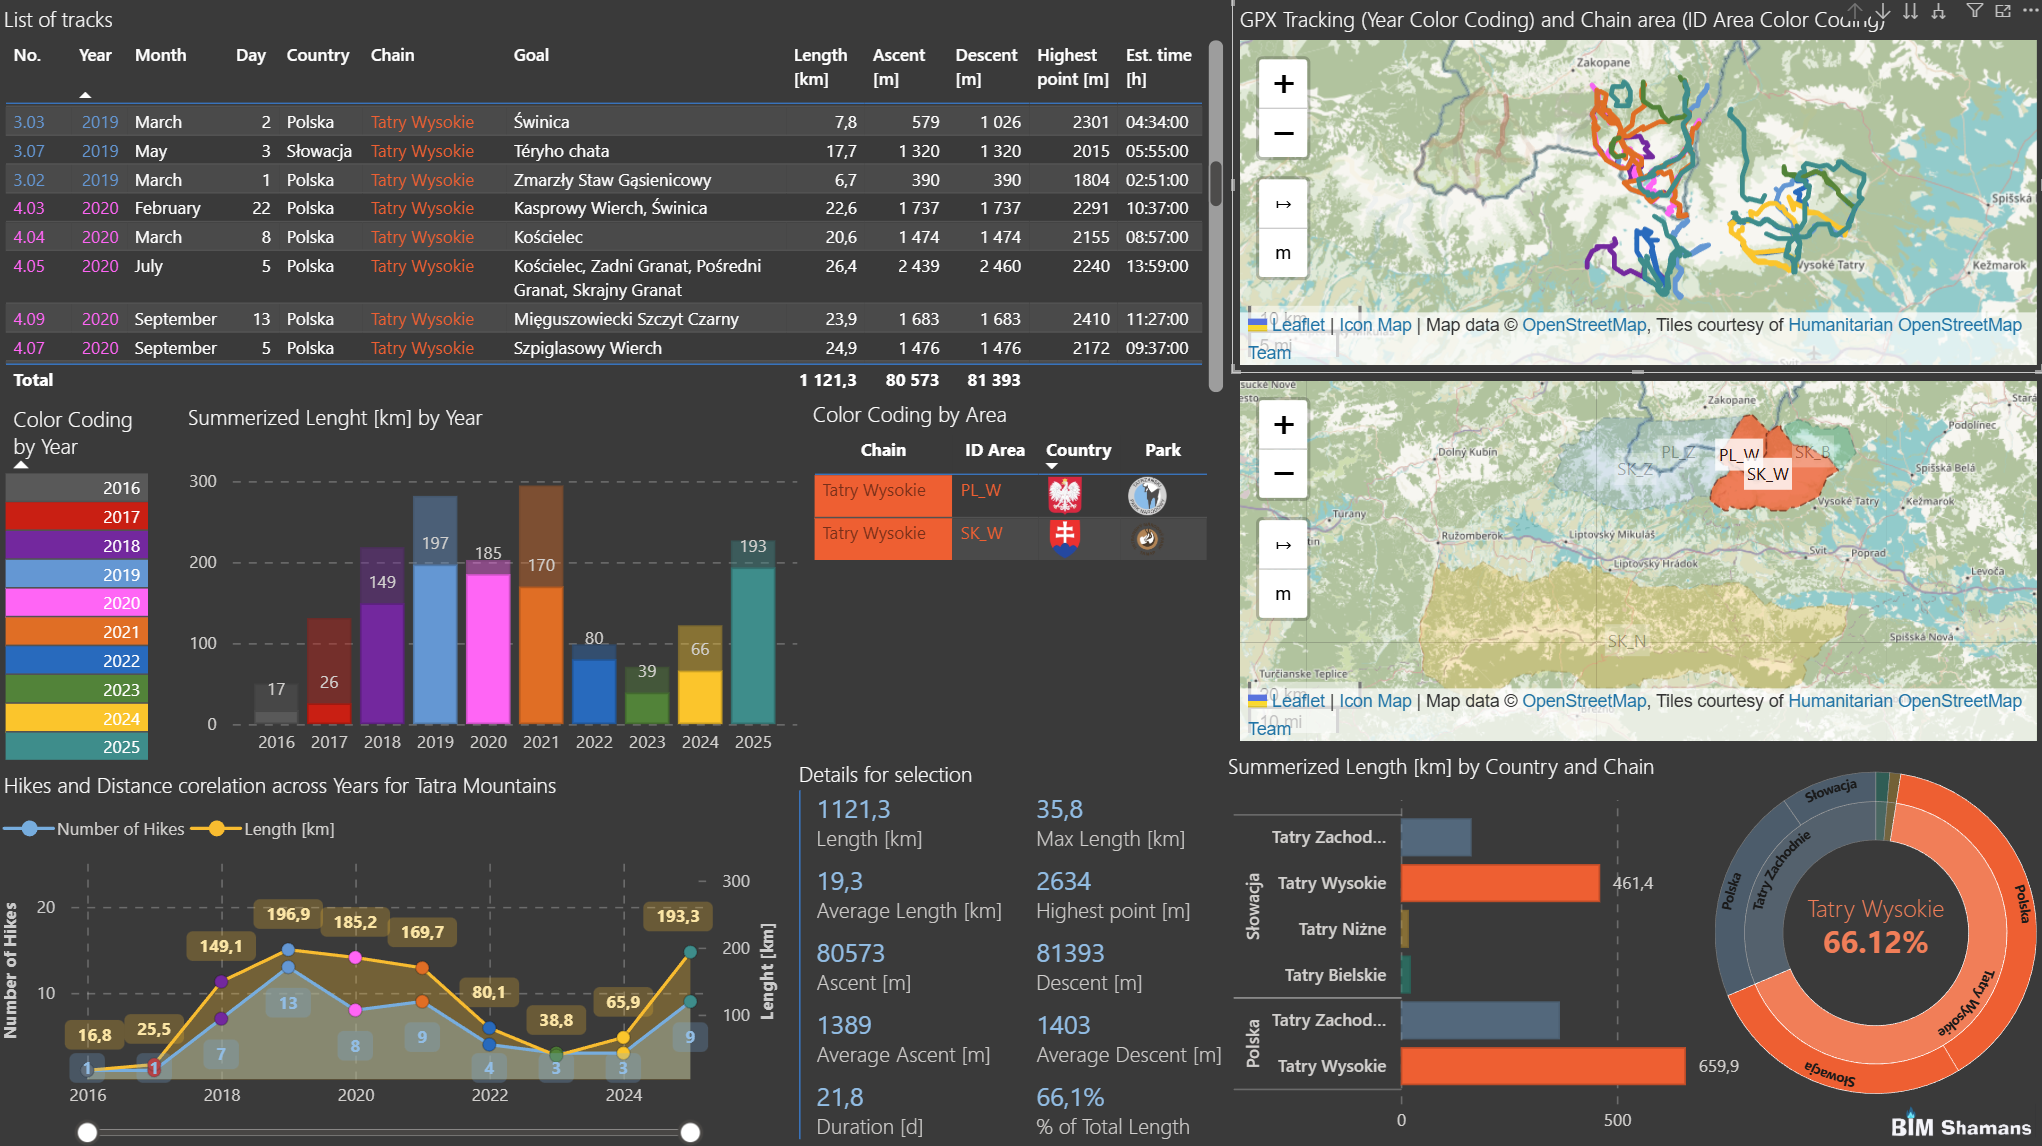
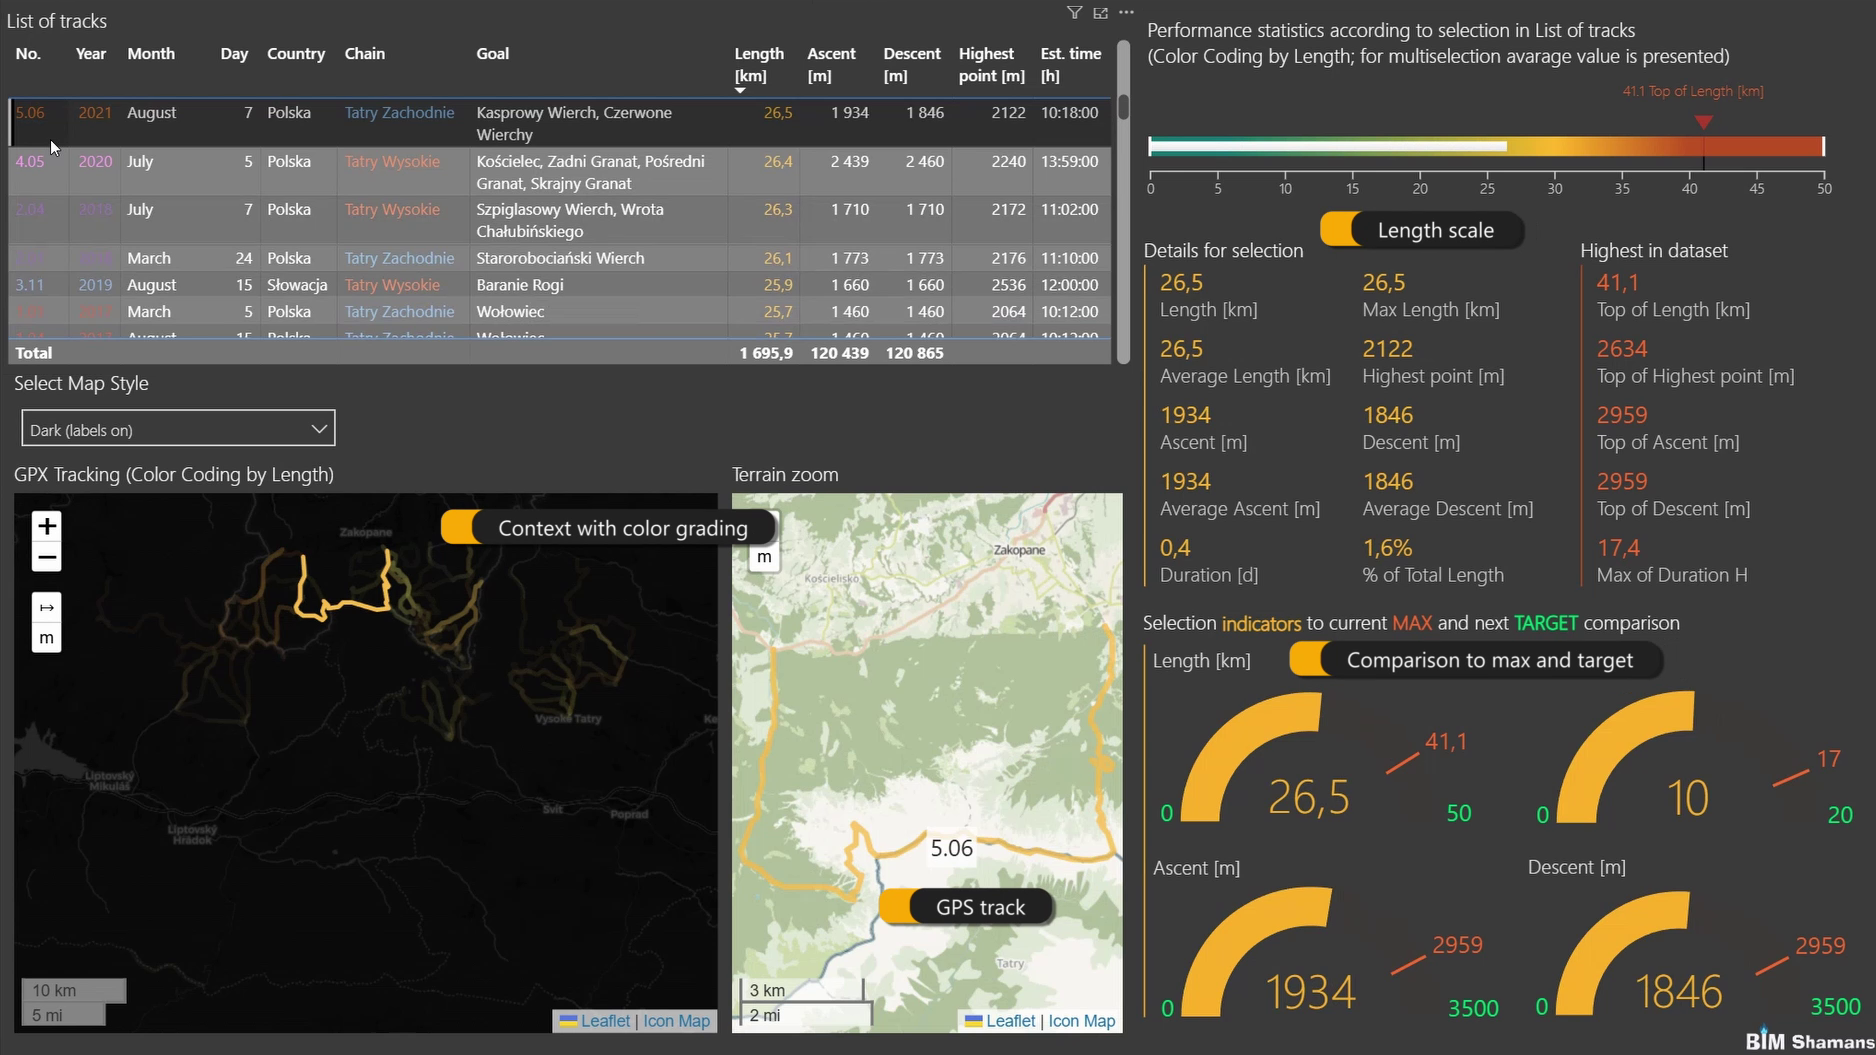
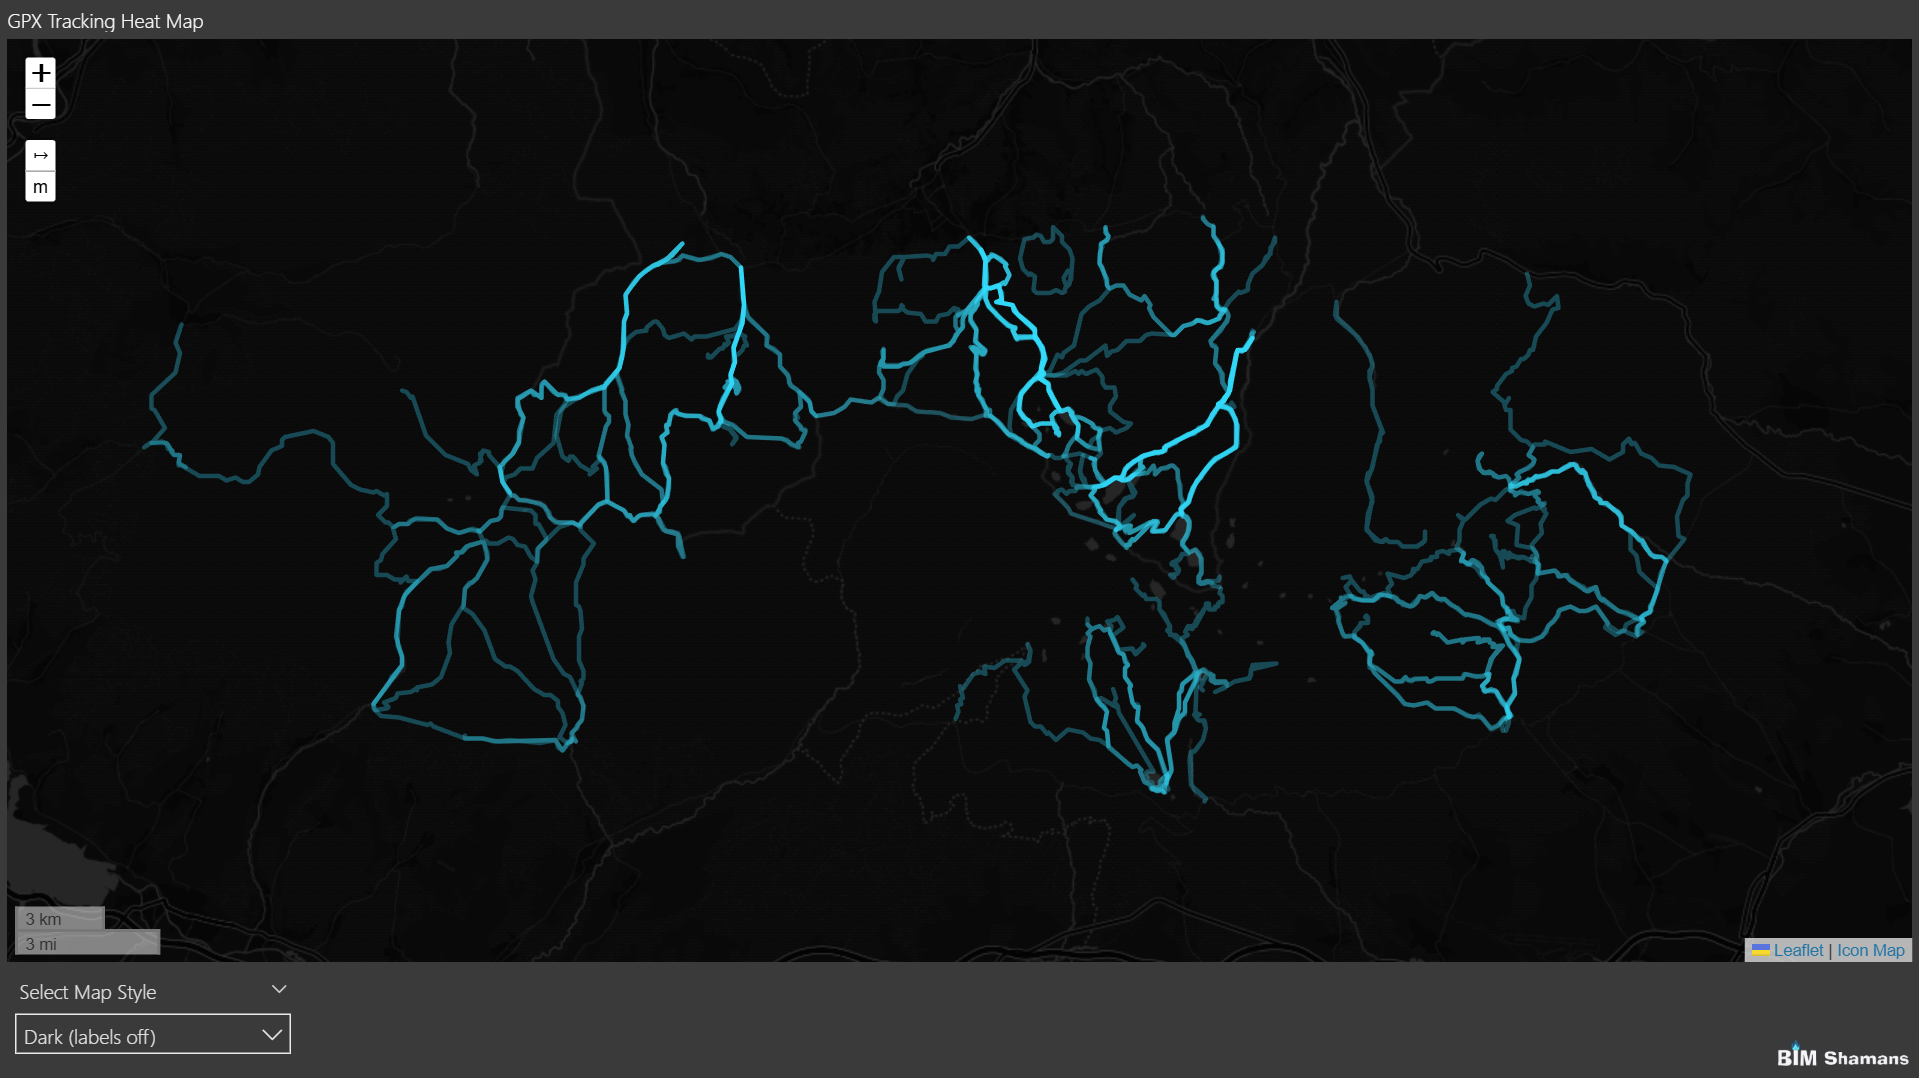
Hike Tracker dashboard overview

Hike Tracker Dashboard

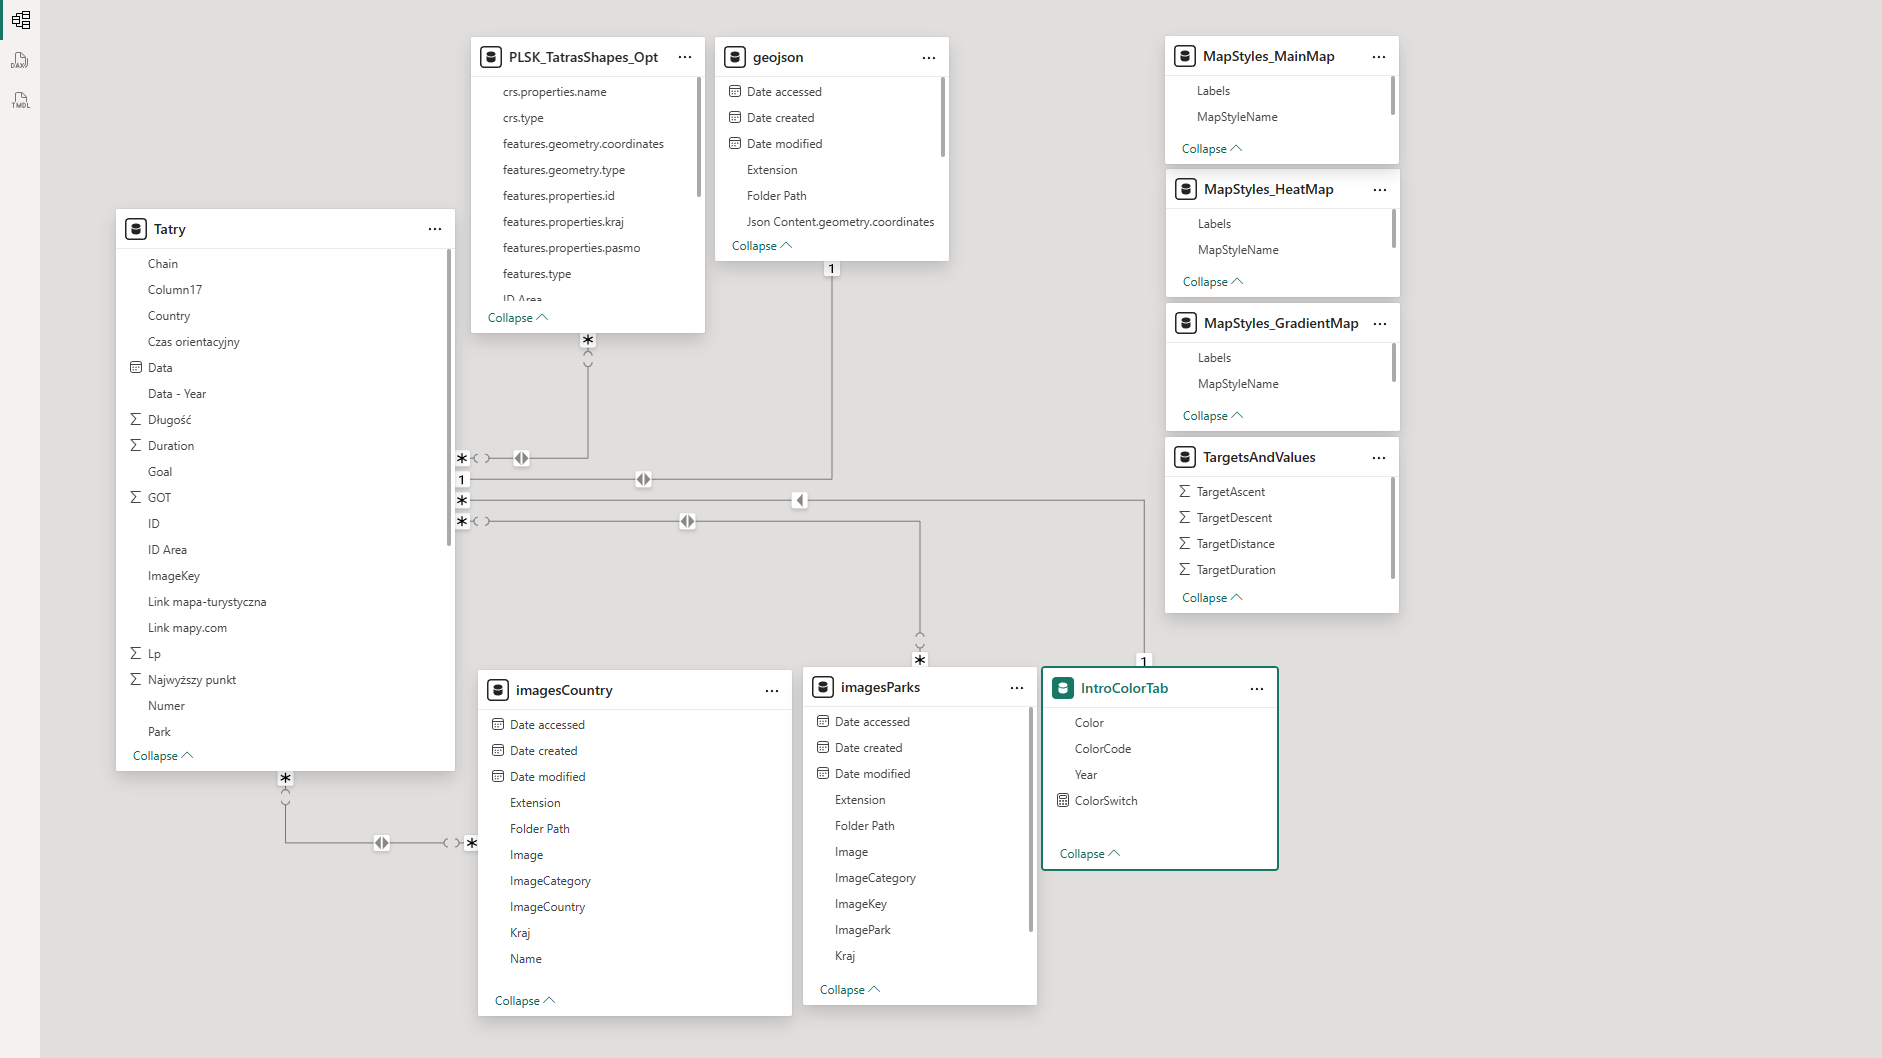
GPX tracks, multiple data sources and the strong need to find out how journeys looked like. Who doesn't like tracking their own activities across time and area? Almost 100 hiking tracks across the Tatra Mountains come together in tables, bar charts, gauges, and even interactive terrain maps or a heat map view.

Key challenges along the way:

  • Python: ~25 MB of raw GPS data simplified and reduced by 93% without losing context and crucial points (hundreds of thousands of points hurt performance).
  • Power BI: data model with dynamic color coding across visuals and maps (complex measures and functions).
  • QGIS: extracted and converted national park and country boundaries into lightweight shapes.
  • Power Automate: automated GPX download and coded naming based on URL + hike ID (no manual UI interaction required).

Power BI Power BI PowerShell QGIS Power Automate
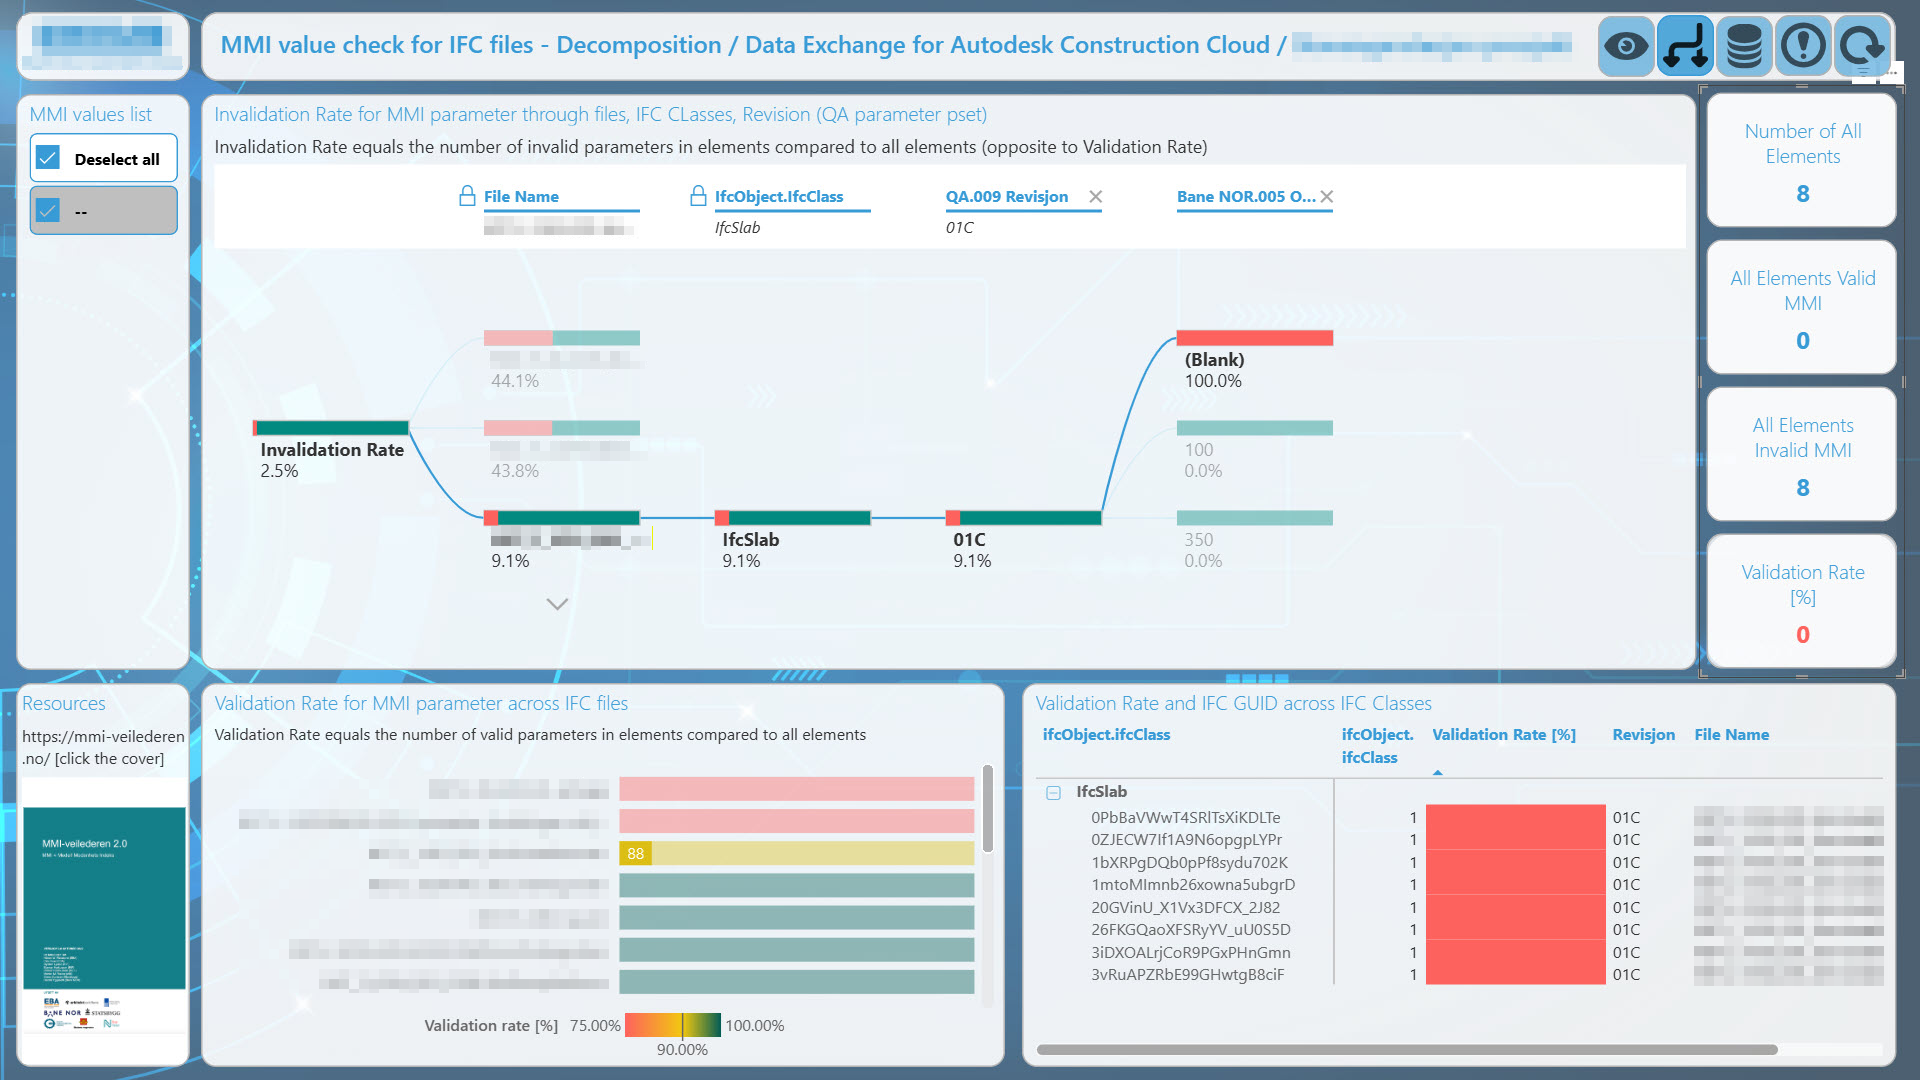
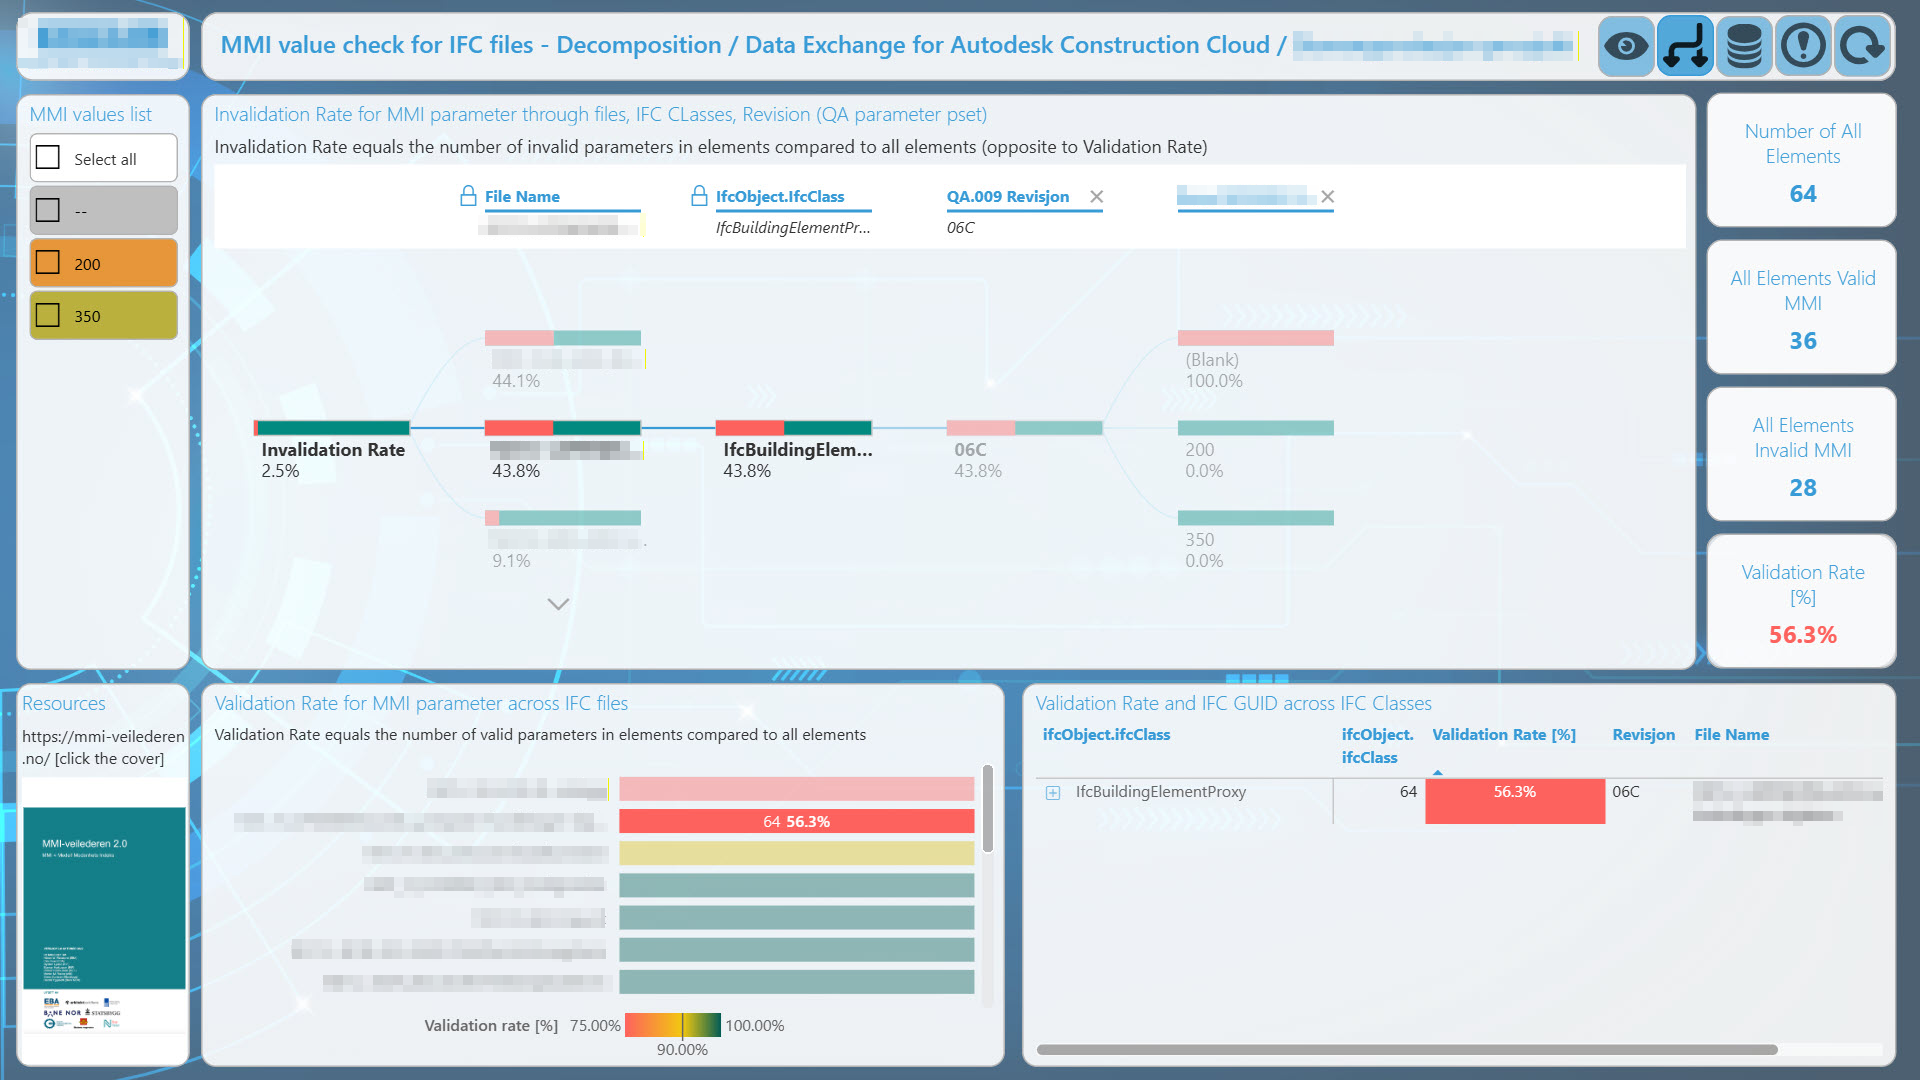
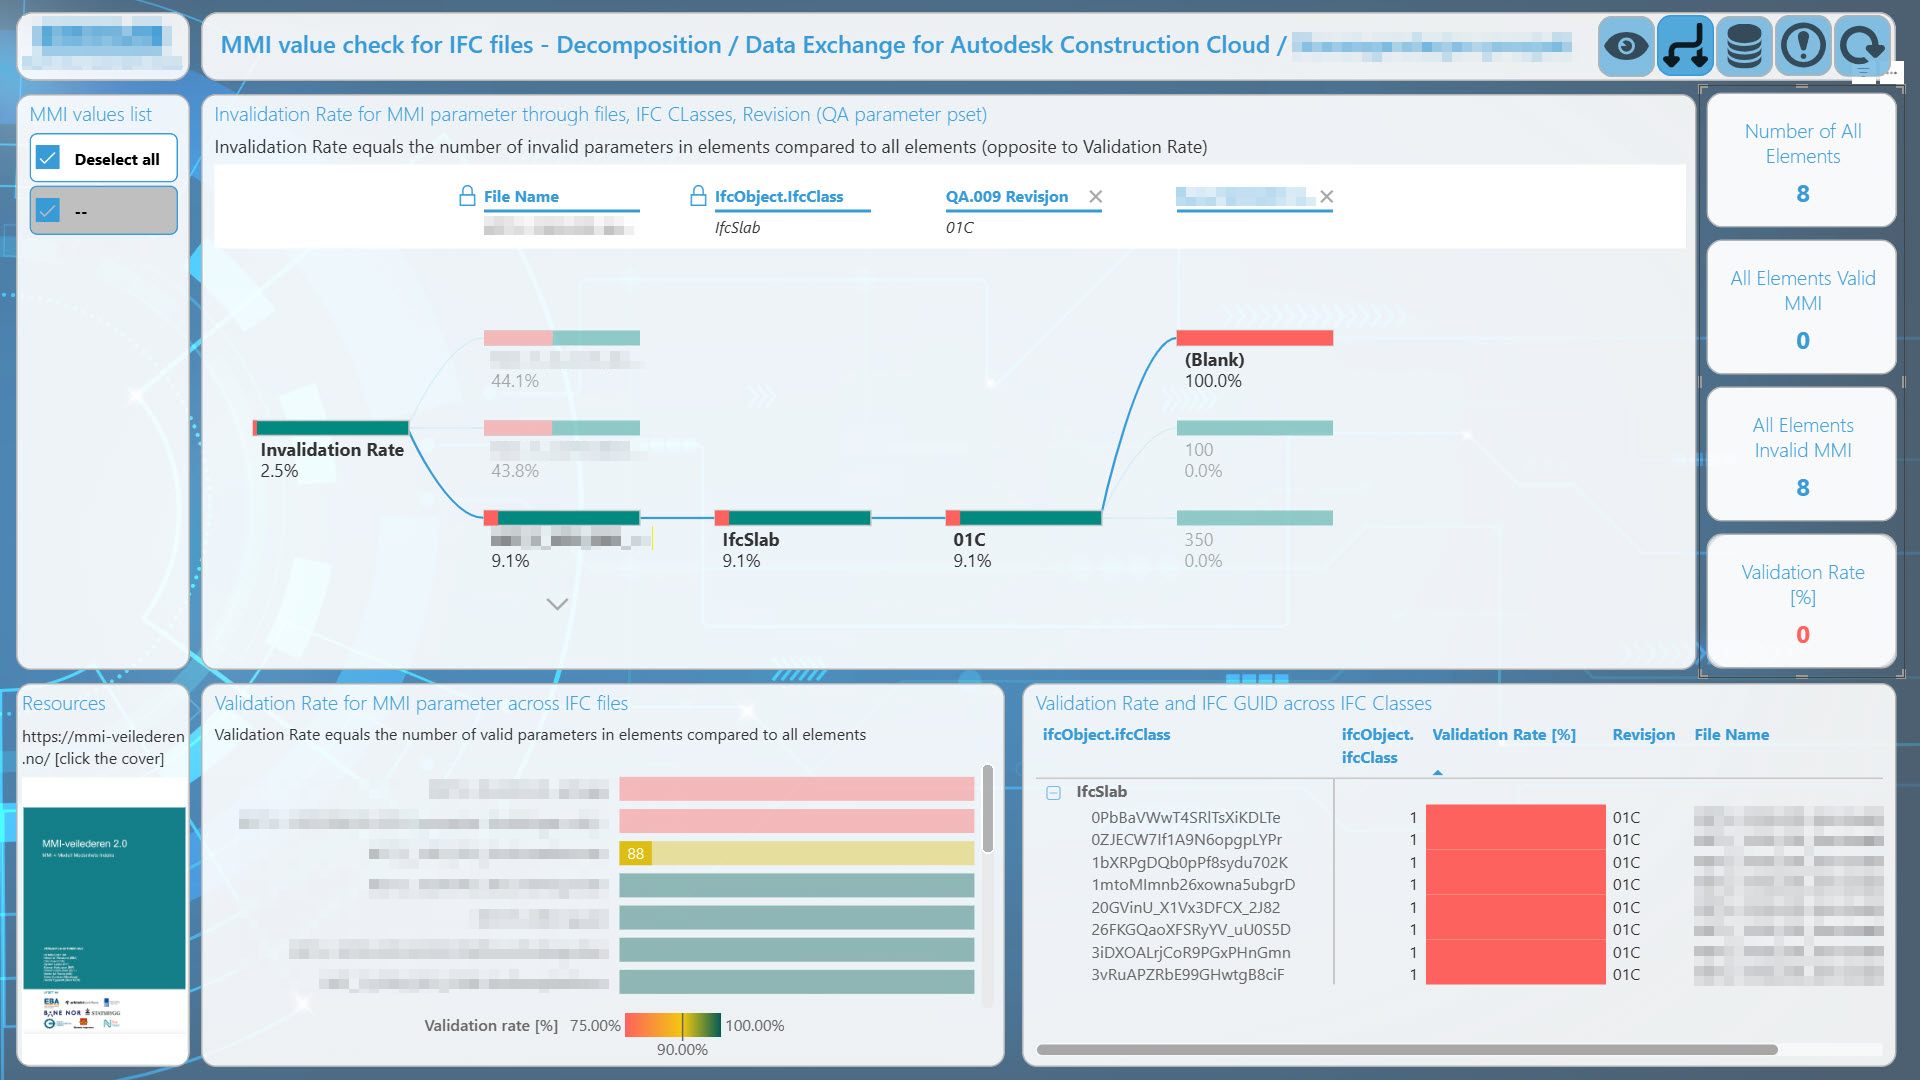
IFC MMI Data dashboard overview

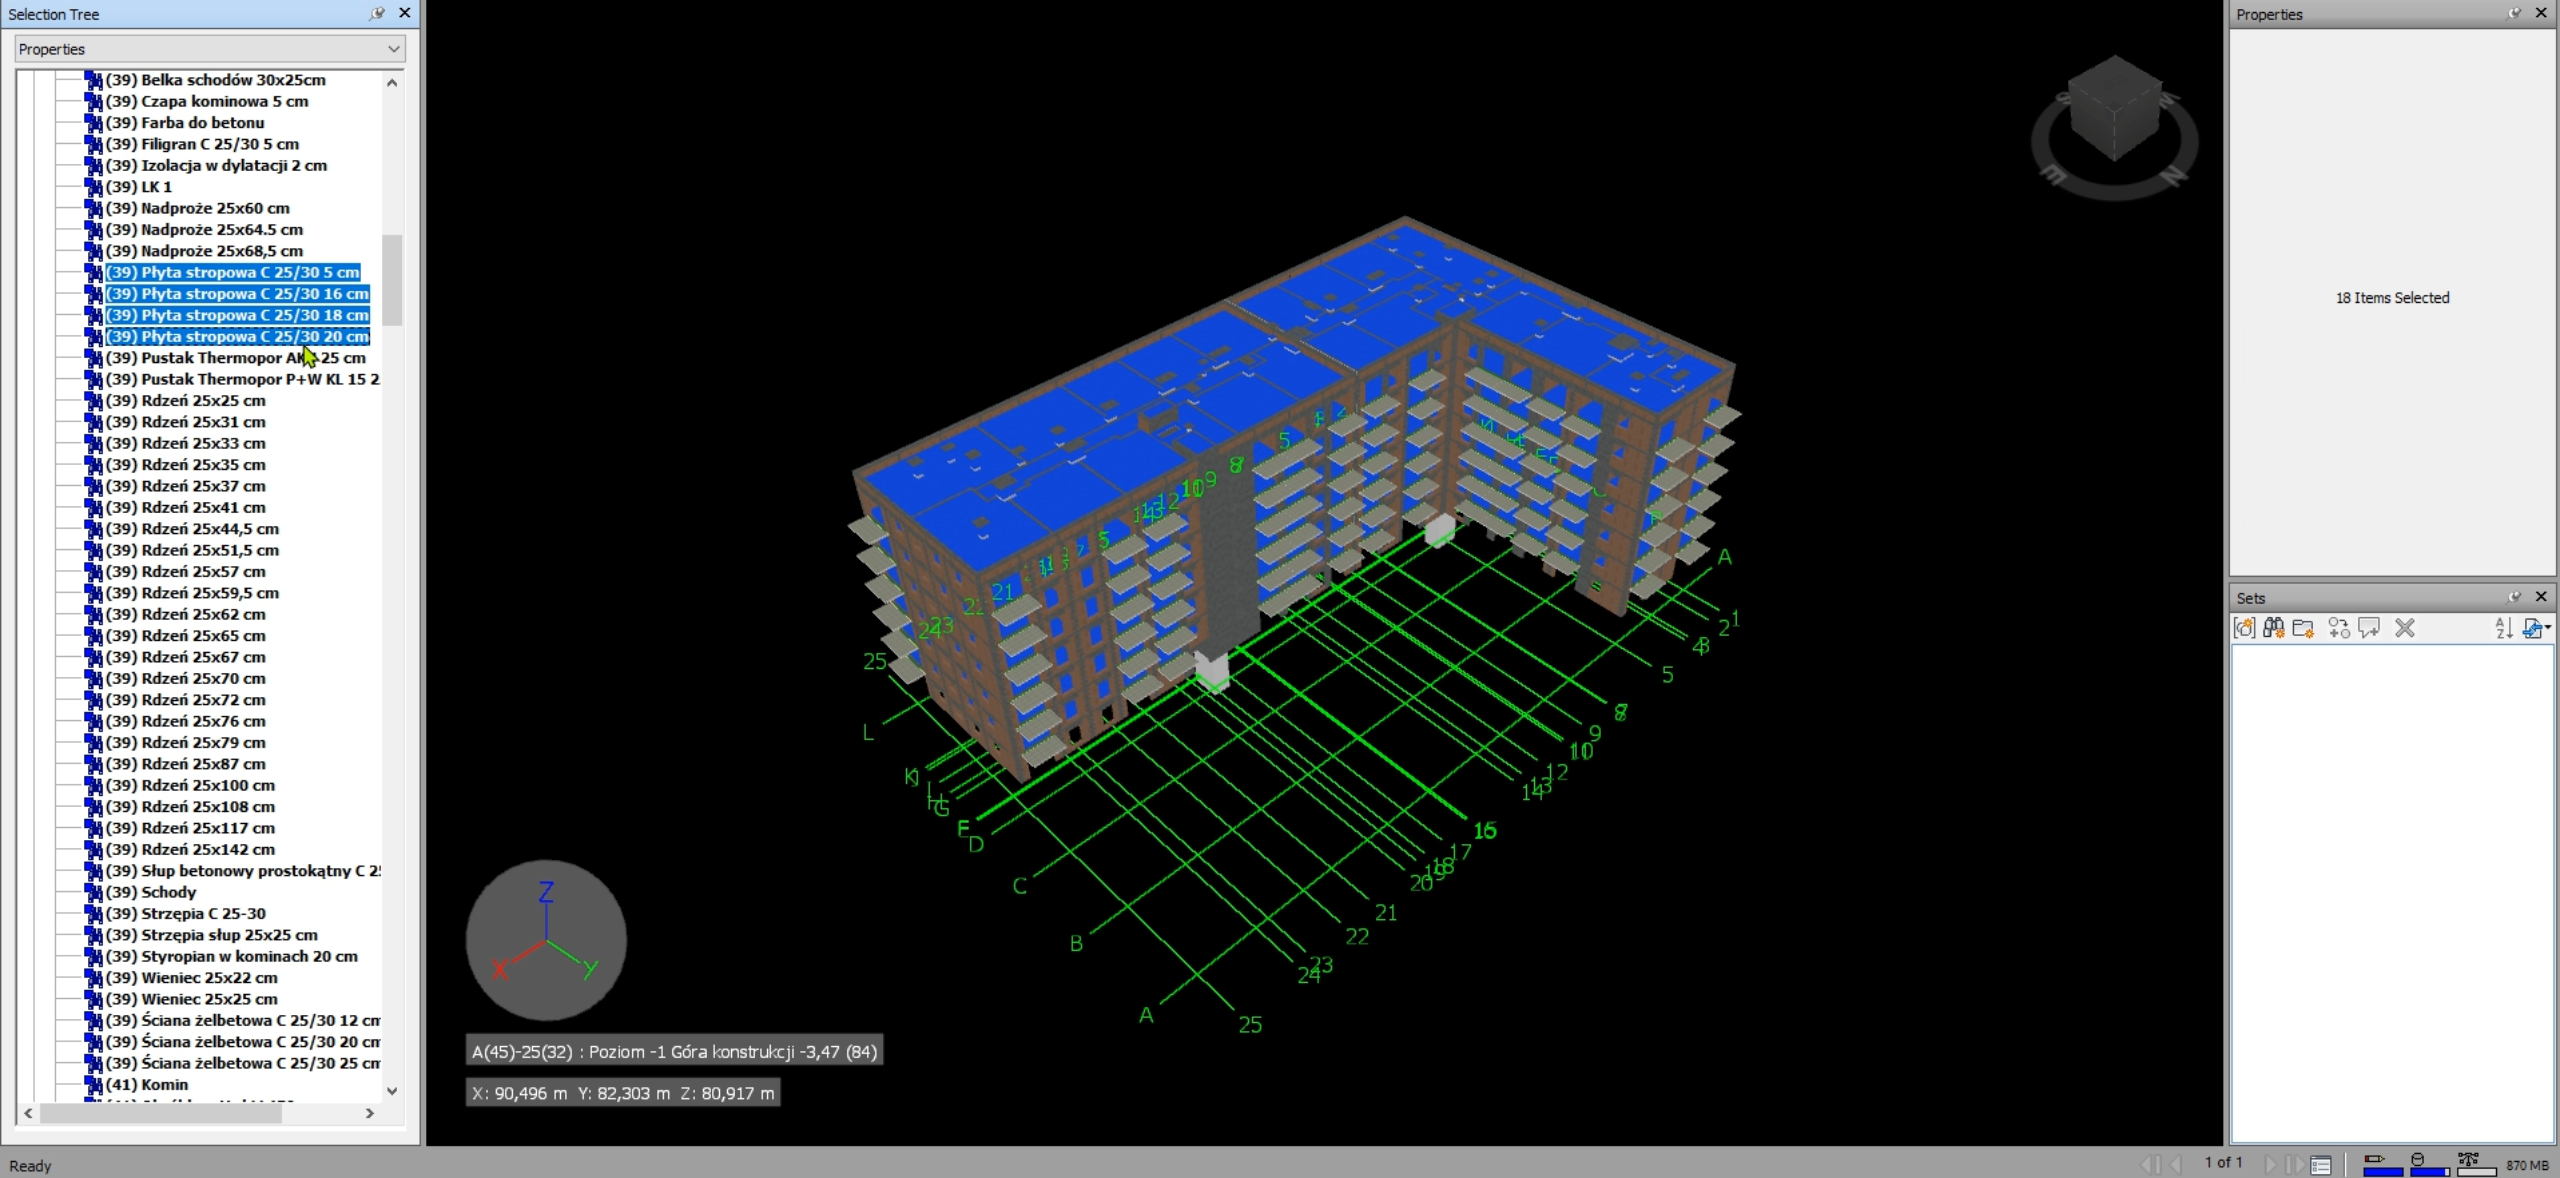
IFC MMI Check across ACC stored files

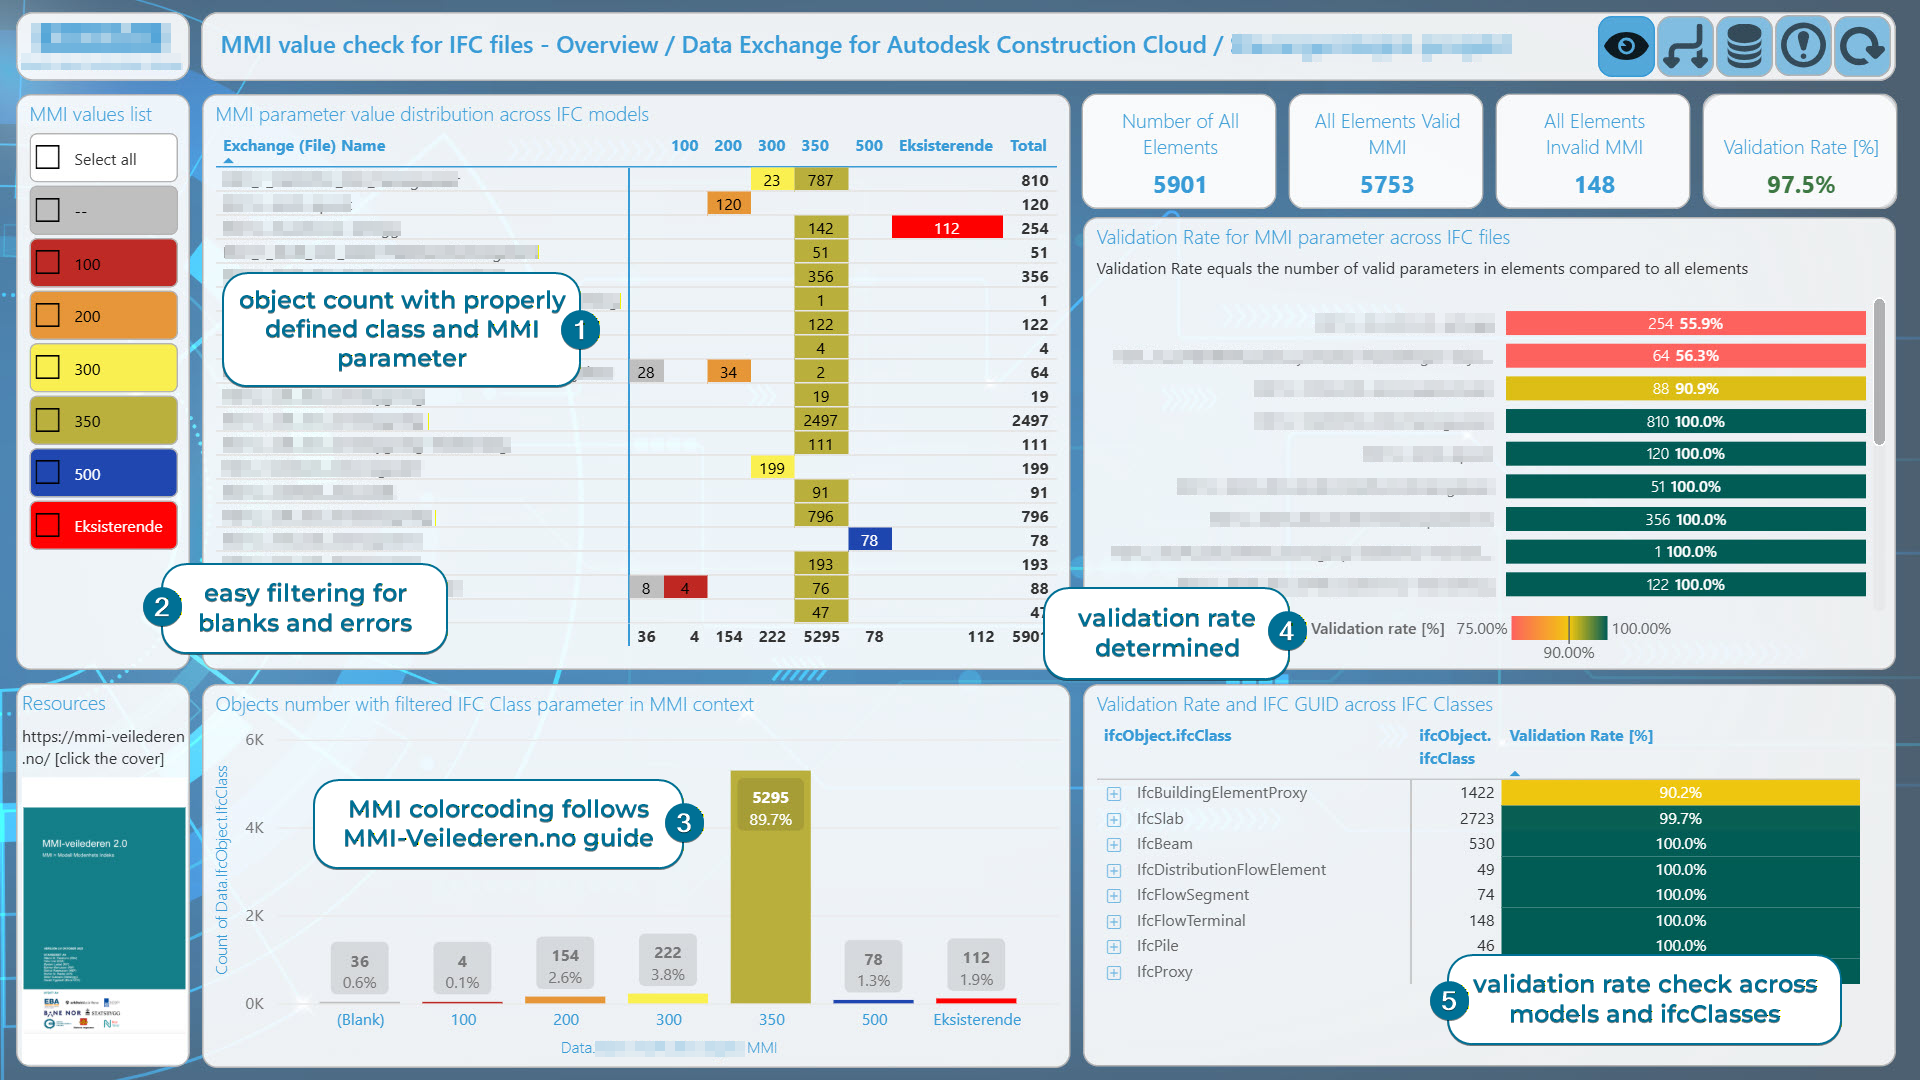
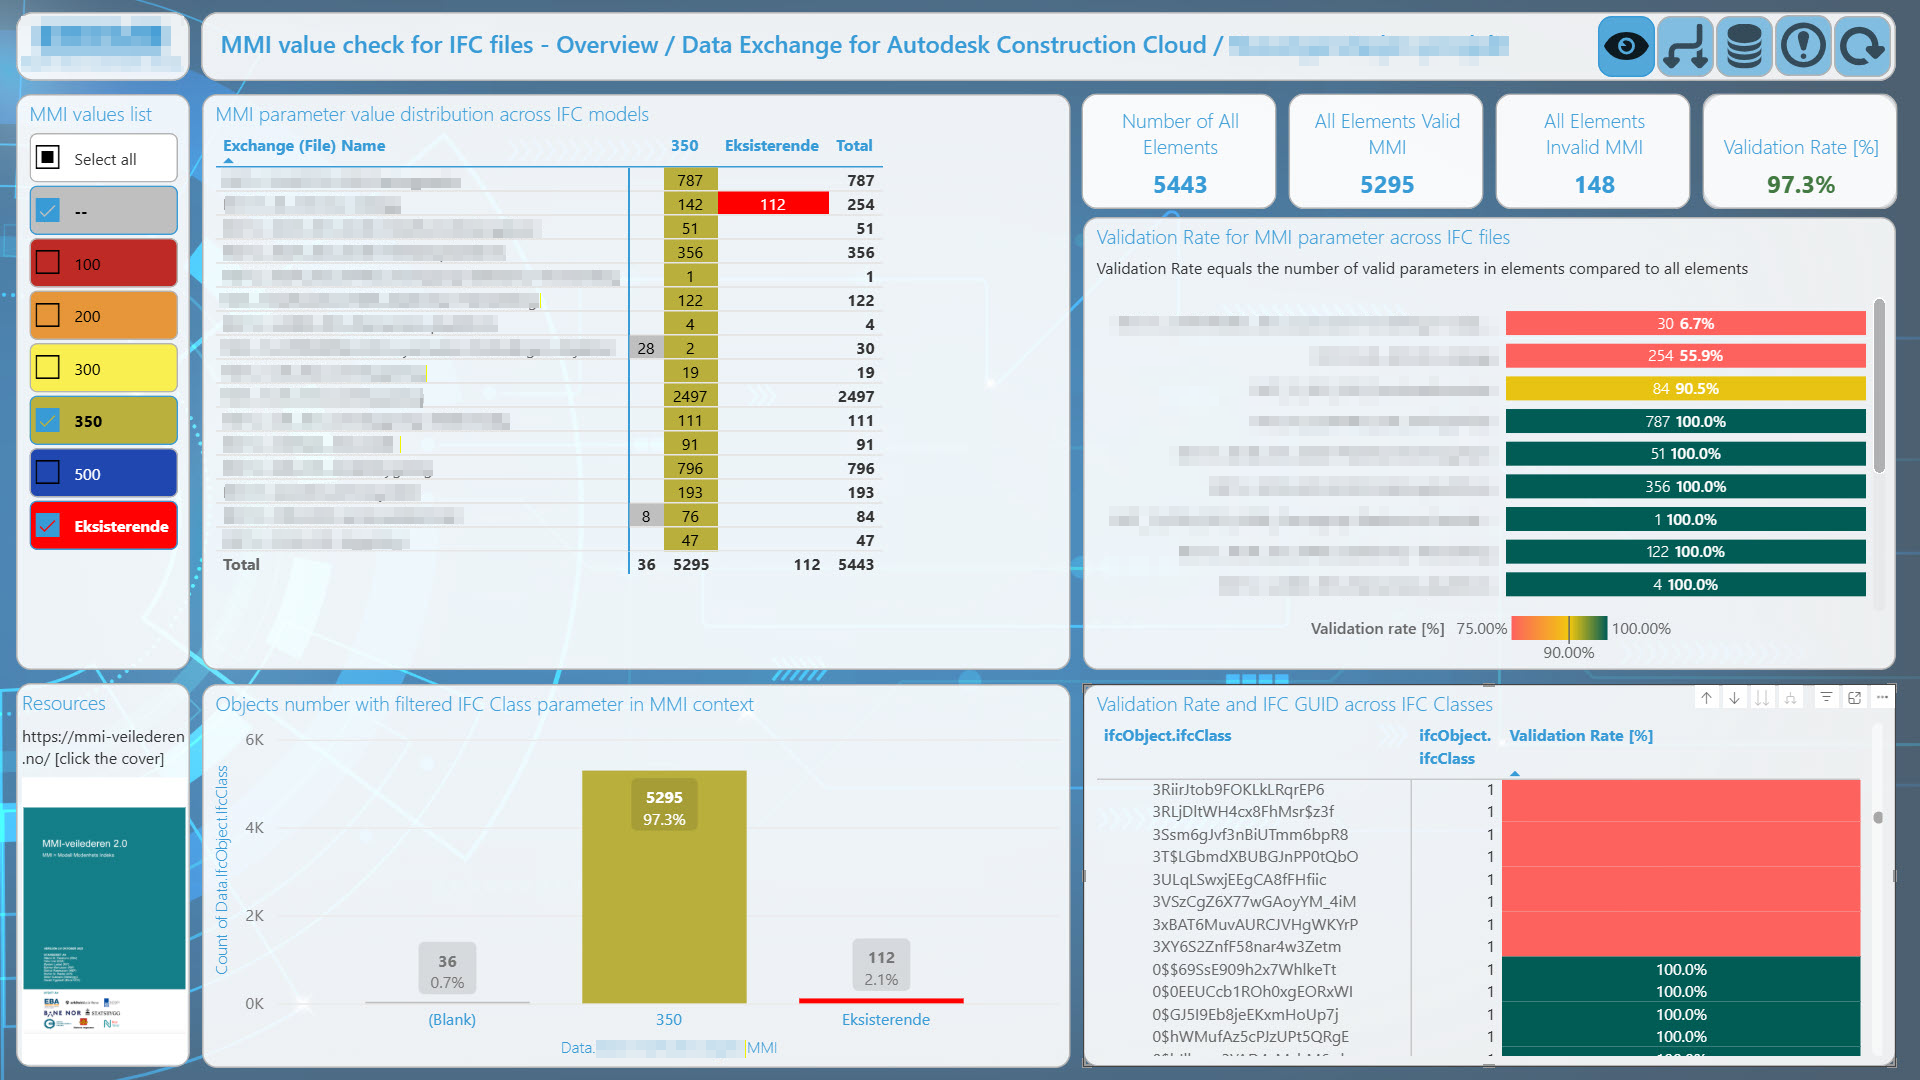
IFC-based objects maturity check and interactive reporting is an example of diving into data to catch that one, specified insight and bring it to the table as a main page of CDE, Sharepoint or a part of dashboard series to progress monitoring. No overcoplications, newest Data Exchange for IFC files (add-in released by Autodesk on November '25), and a potential of Open format.

There are three conditions, which have to be fulfilled to speak about reliable conclusions:

  • verification of blanks, nulls, incorrect input has to be included, not ommited during data cleaning,
  • validation rate has to be defined,
  • at least one method of fast improper data has to be established - it can be a list of GUIDs or IDs for specified soft, anything allowing manager react precisely: what and where need to be correct with next model revision.

Power BI IFC format Autodesk Data Exchange Autodesk Construction Cloud SharePoint
Hike Tracker dashboard overview

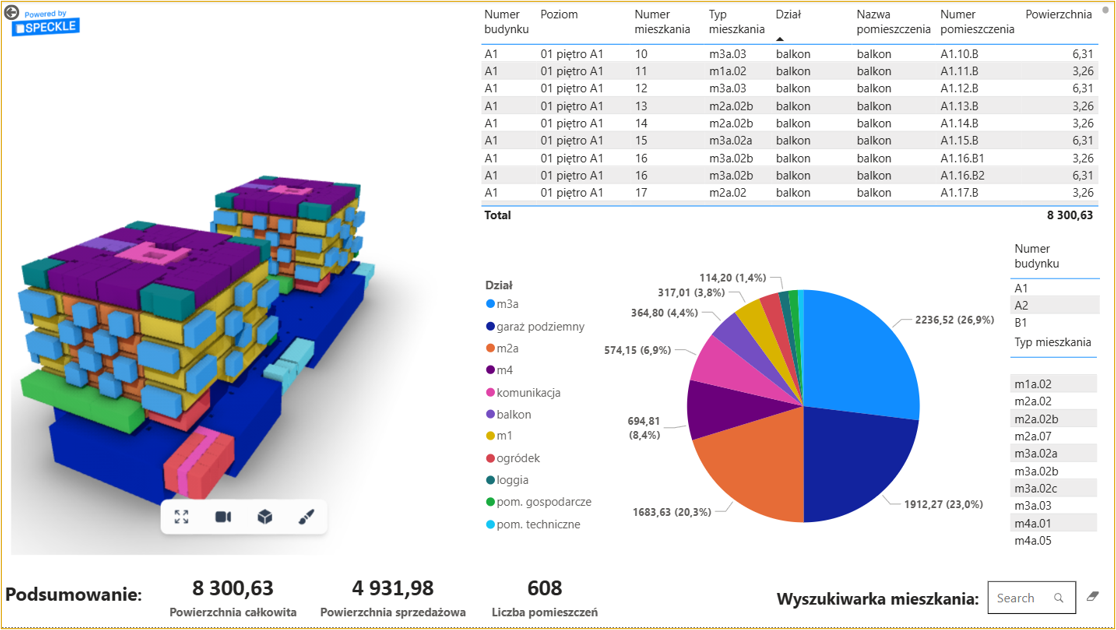
3D Flats BI Reporting

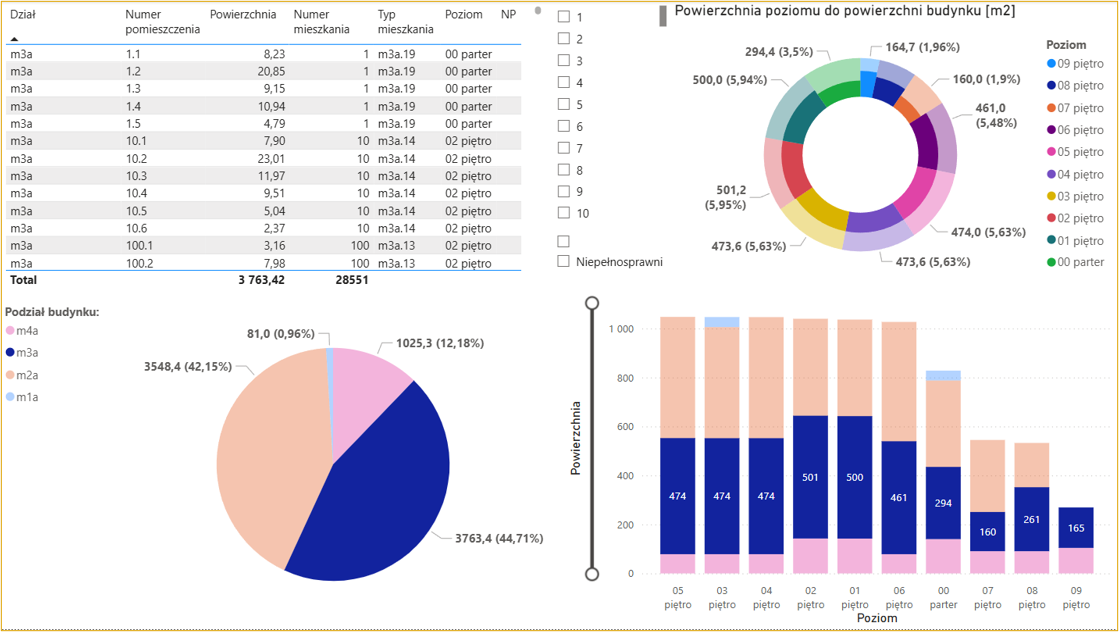
3D-driven BI for residential units on concept design stage brings fresh perspective to requirements analysis. No more pivot tables on one half of screen and drawings on the other half. It can be one, it can interact, it can bring more use from already produced data.

Example shows rooms' bounding boxes, so before data export, quick QA check is required, especially when third party software comes in. Revit users know, sometimes non-geometrical, but still existing room representation can be found! Can affect database and bring a little mess into the dashboard.

Autodesk Revit Power BI Speckle
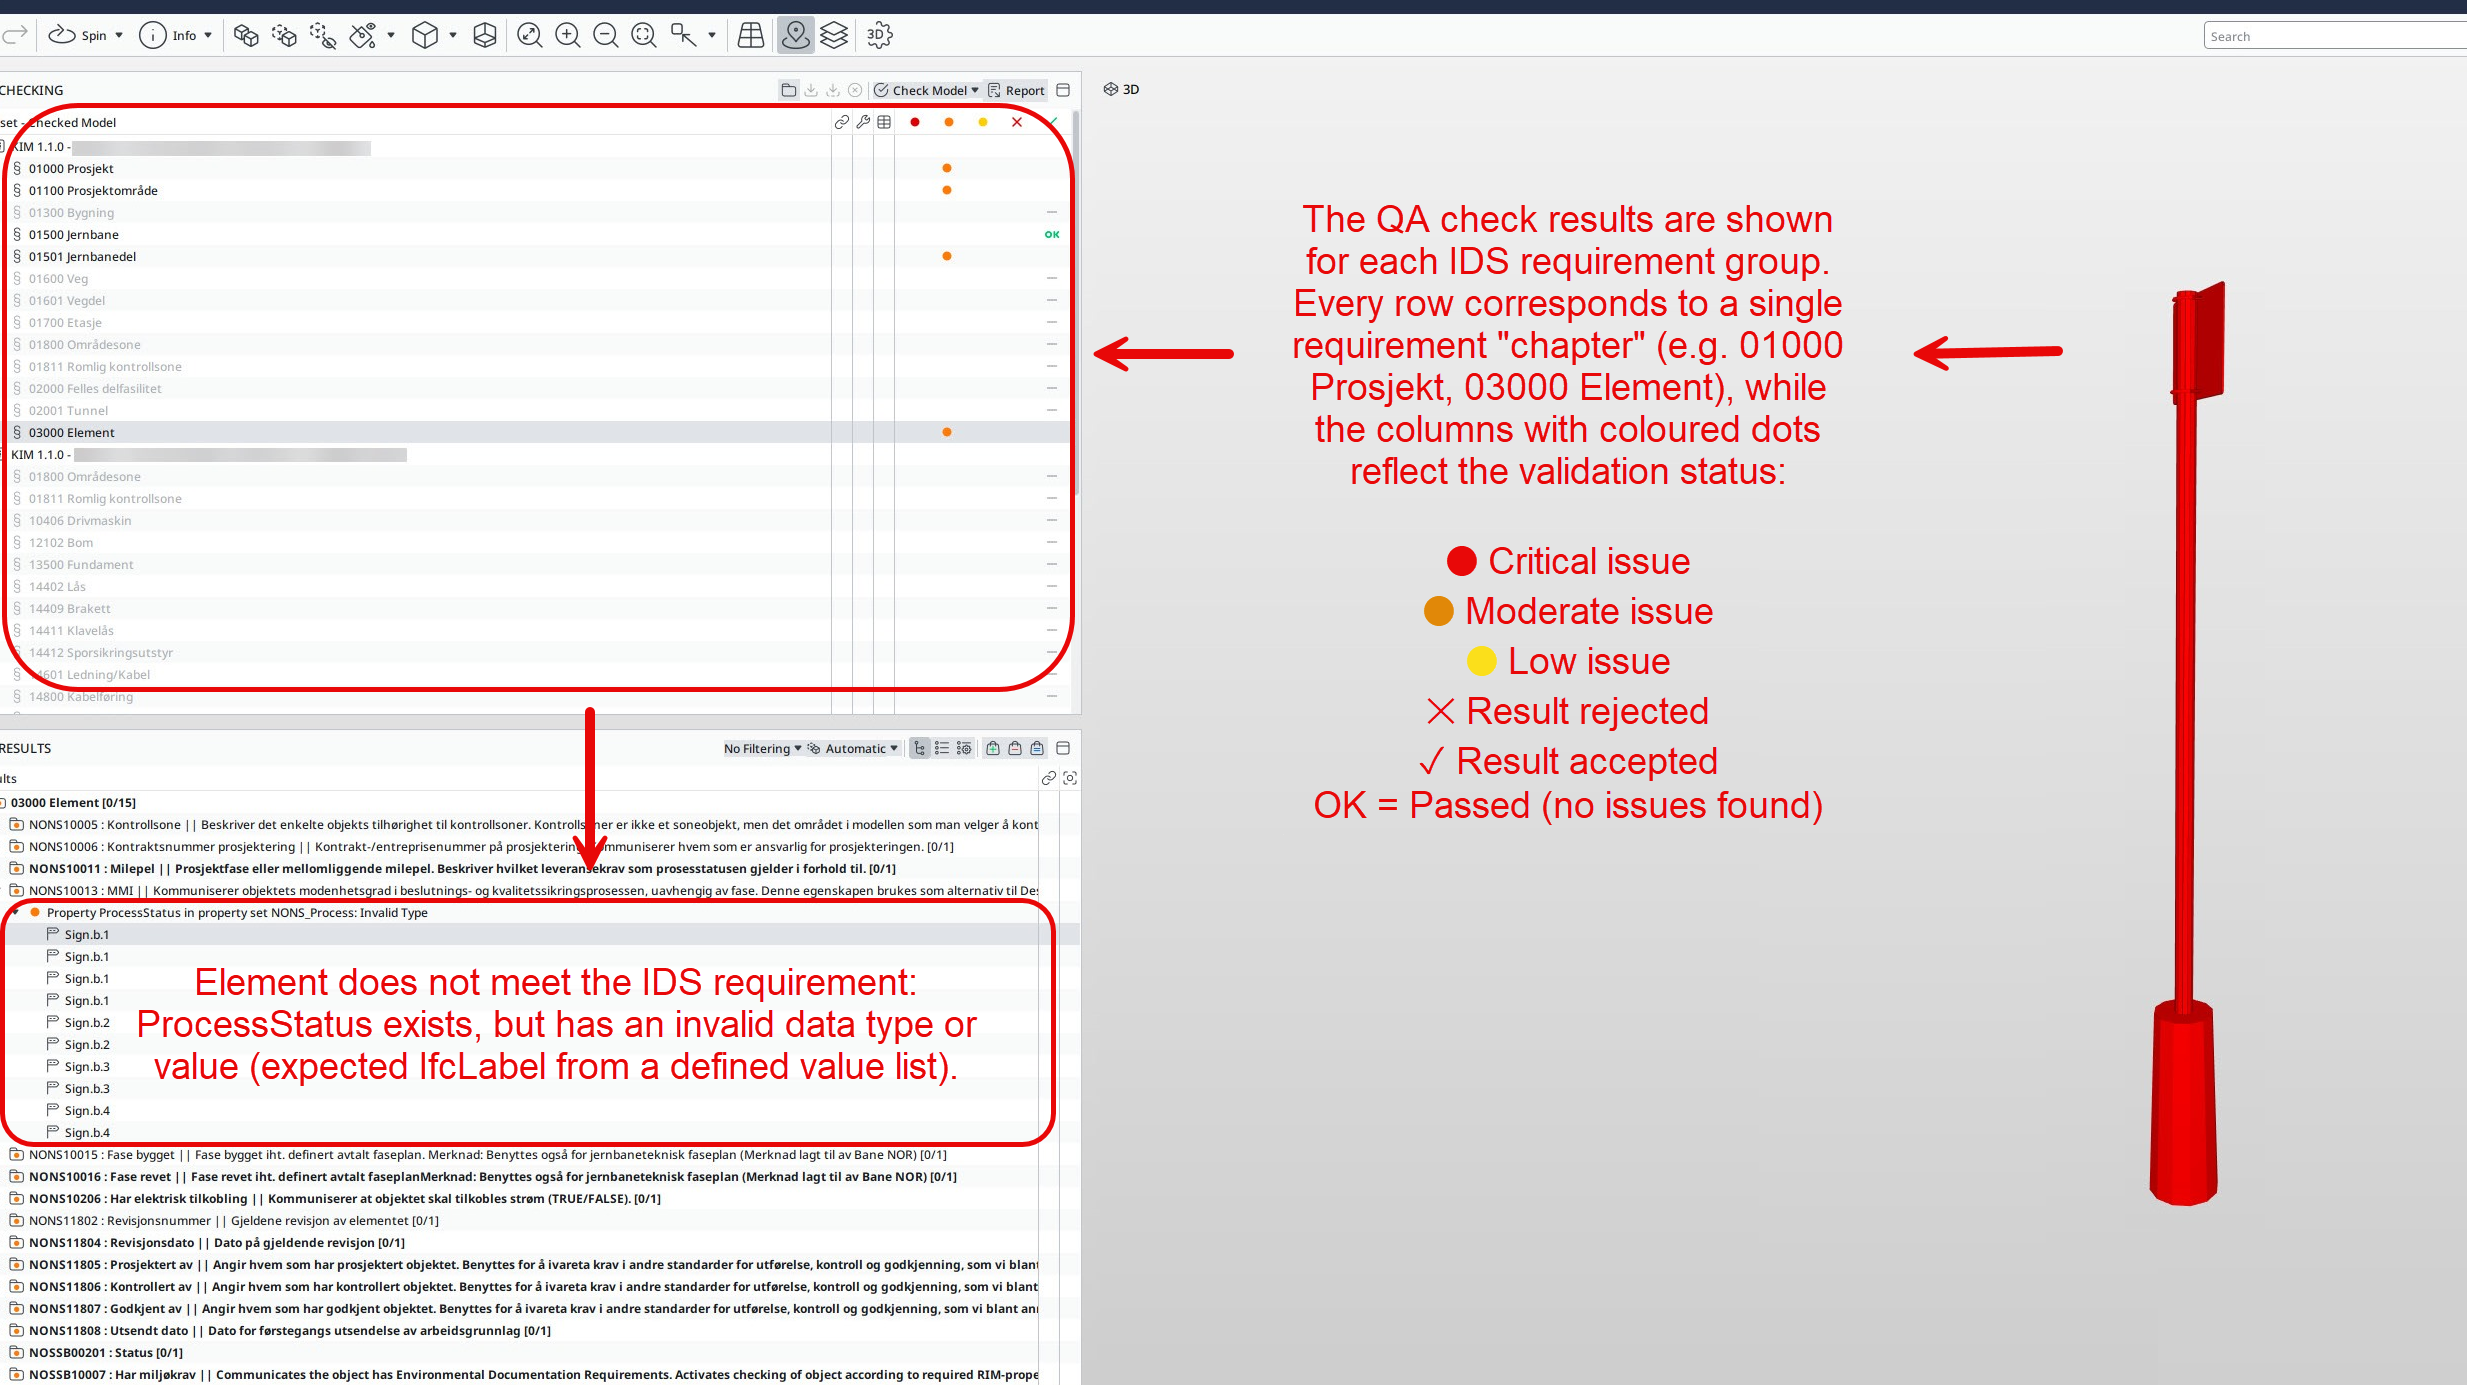
IFC validation scripting
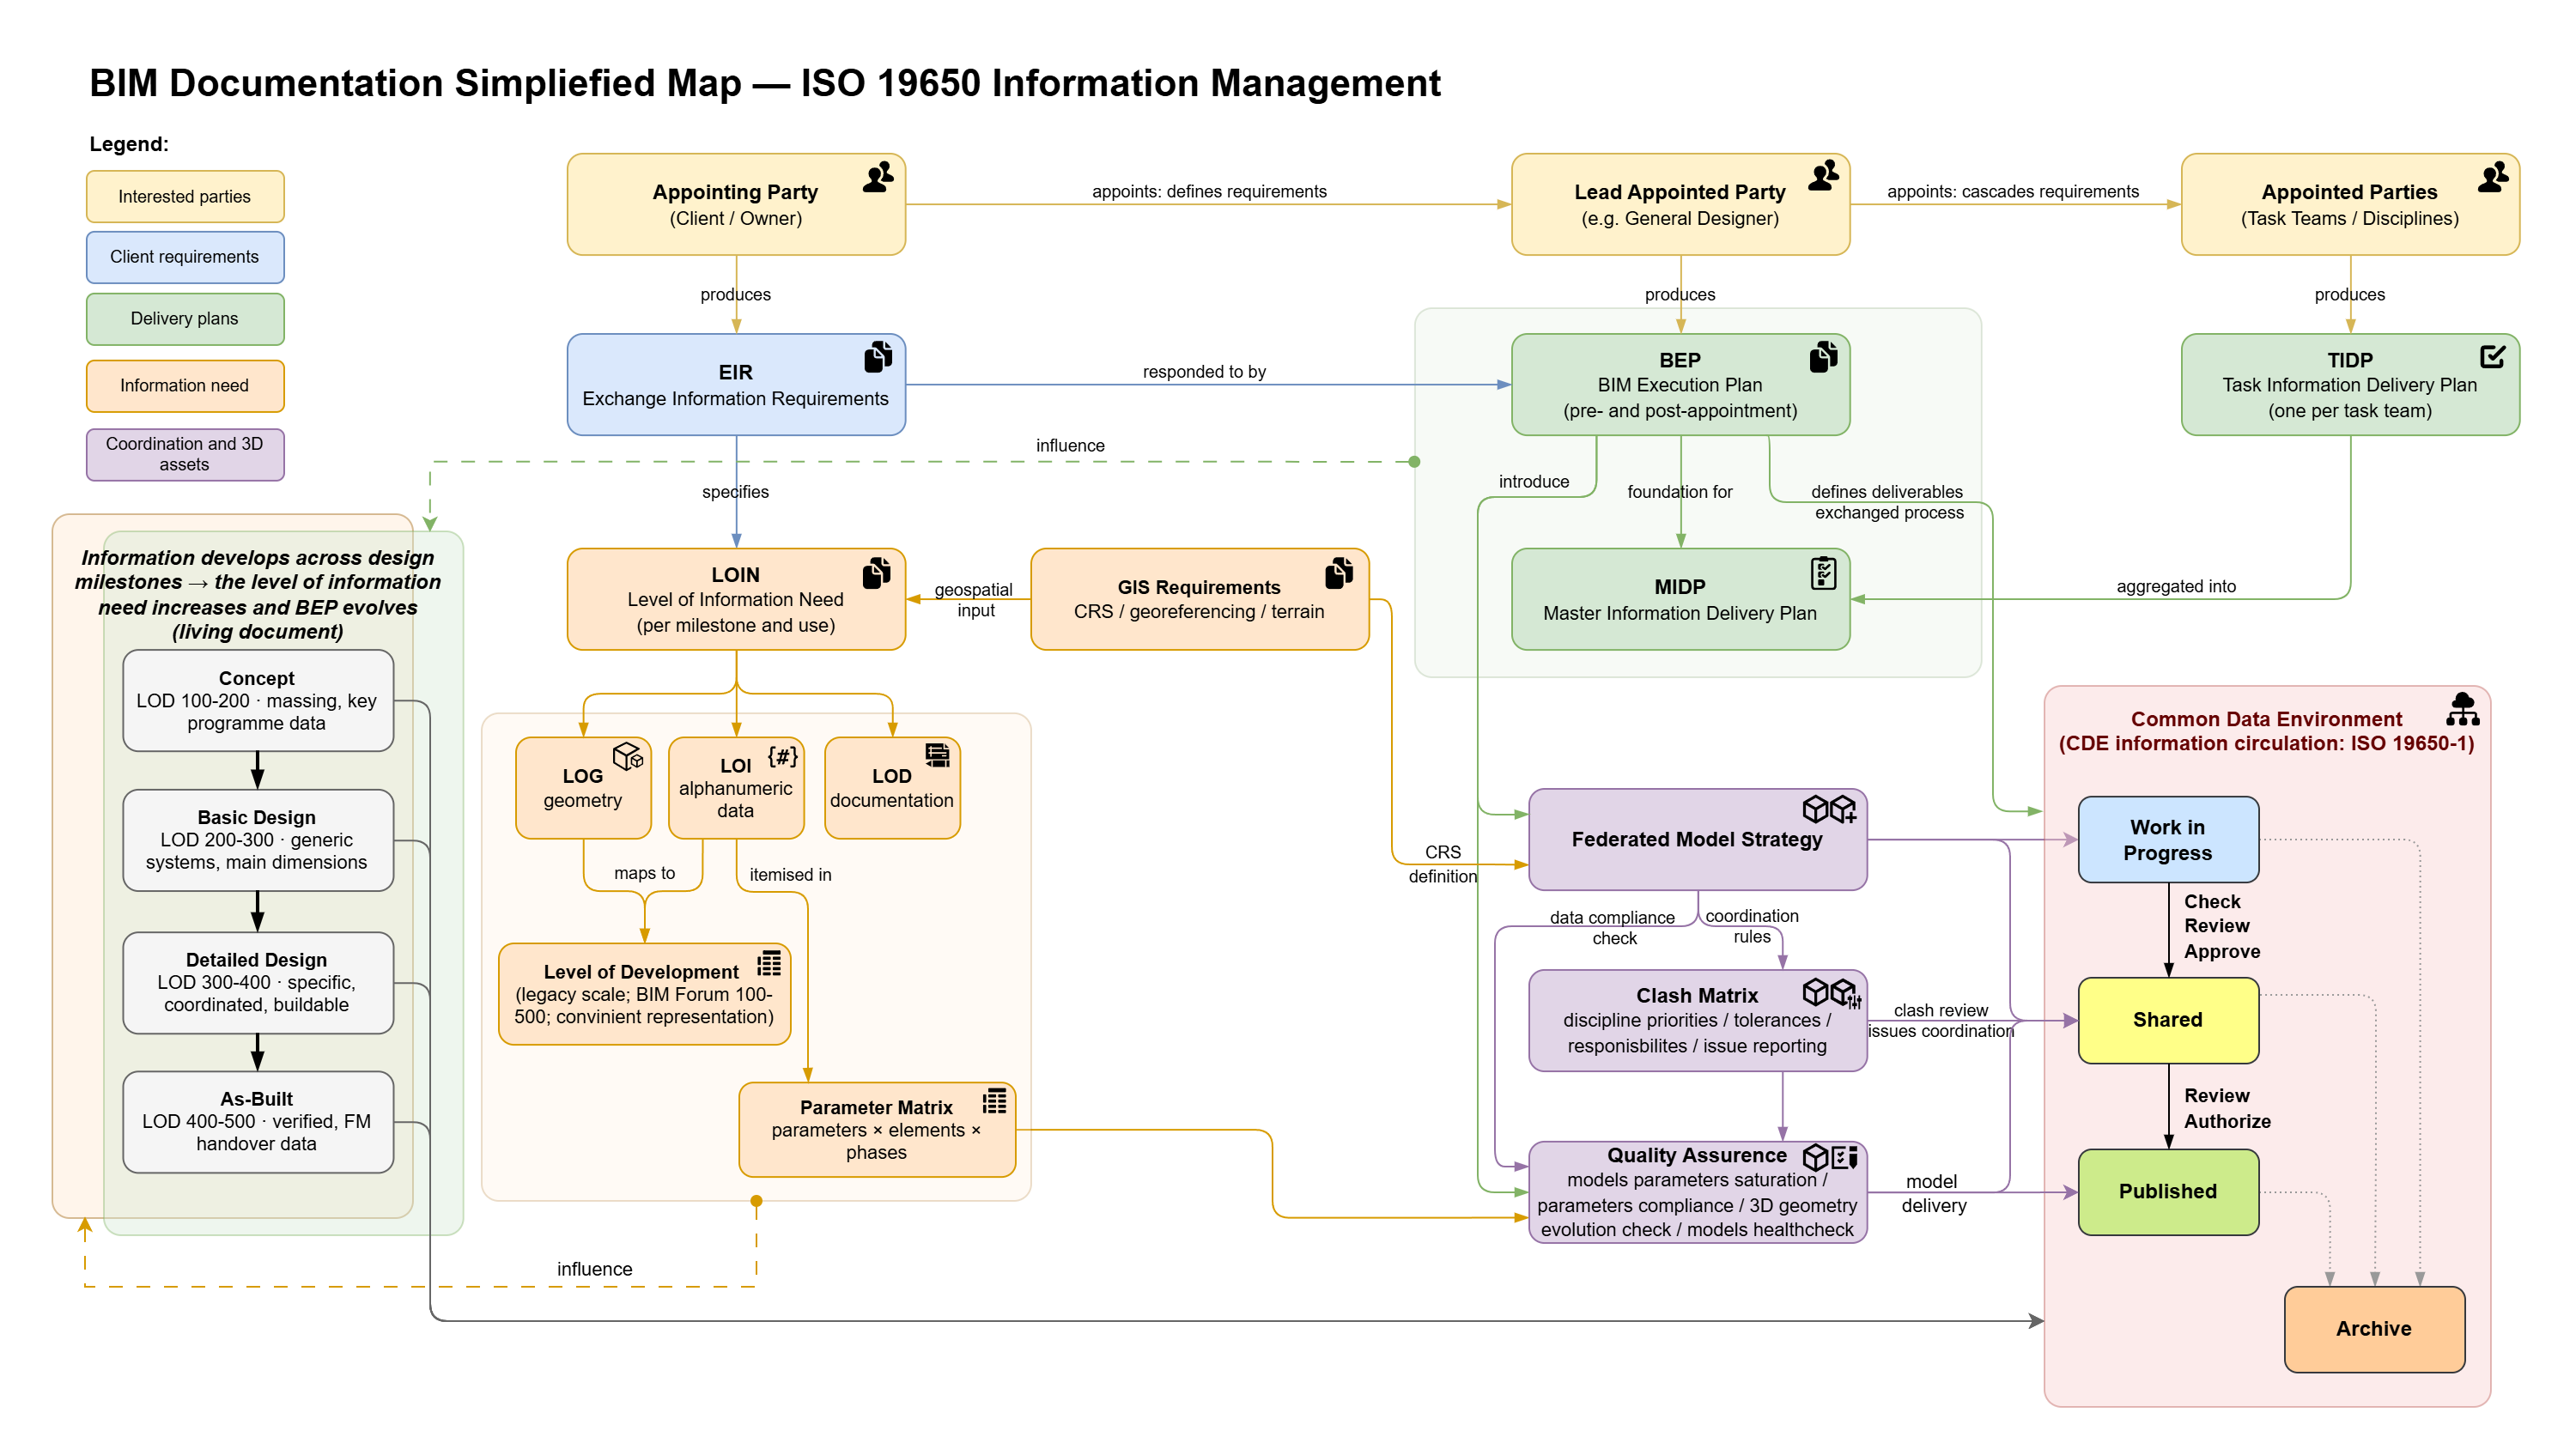
Data validation workflow
IFC validation report
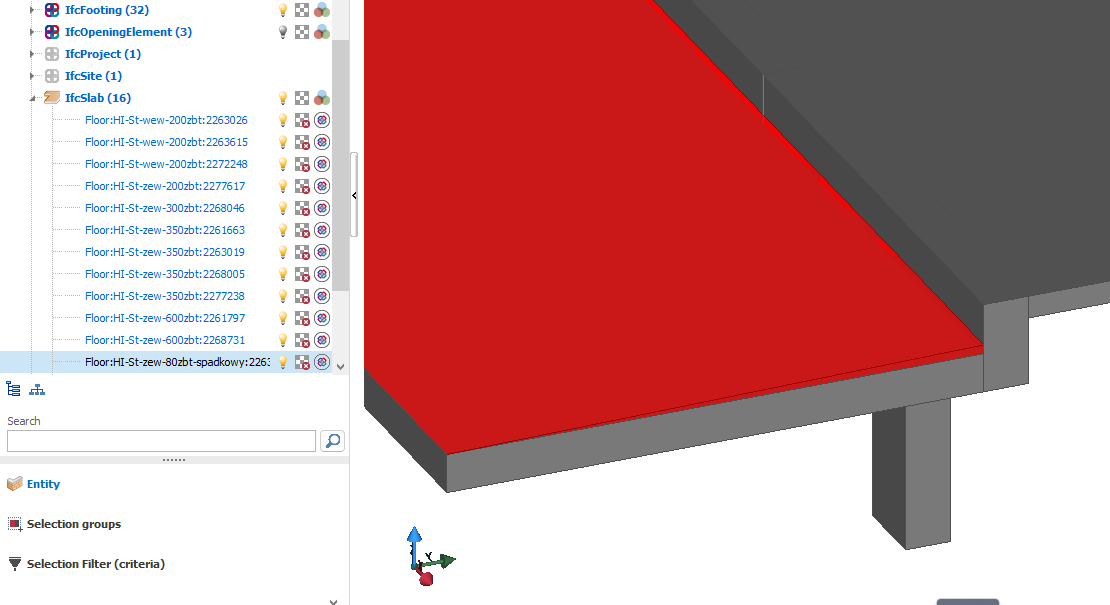
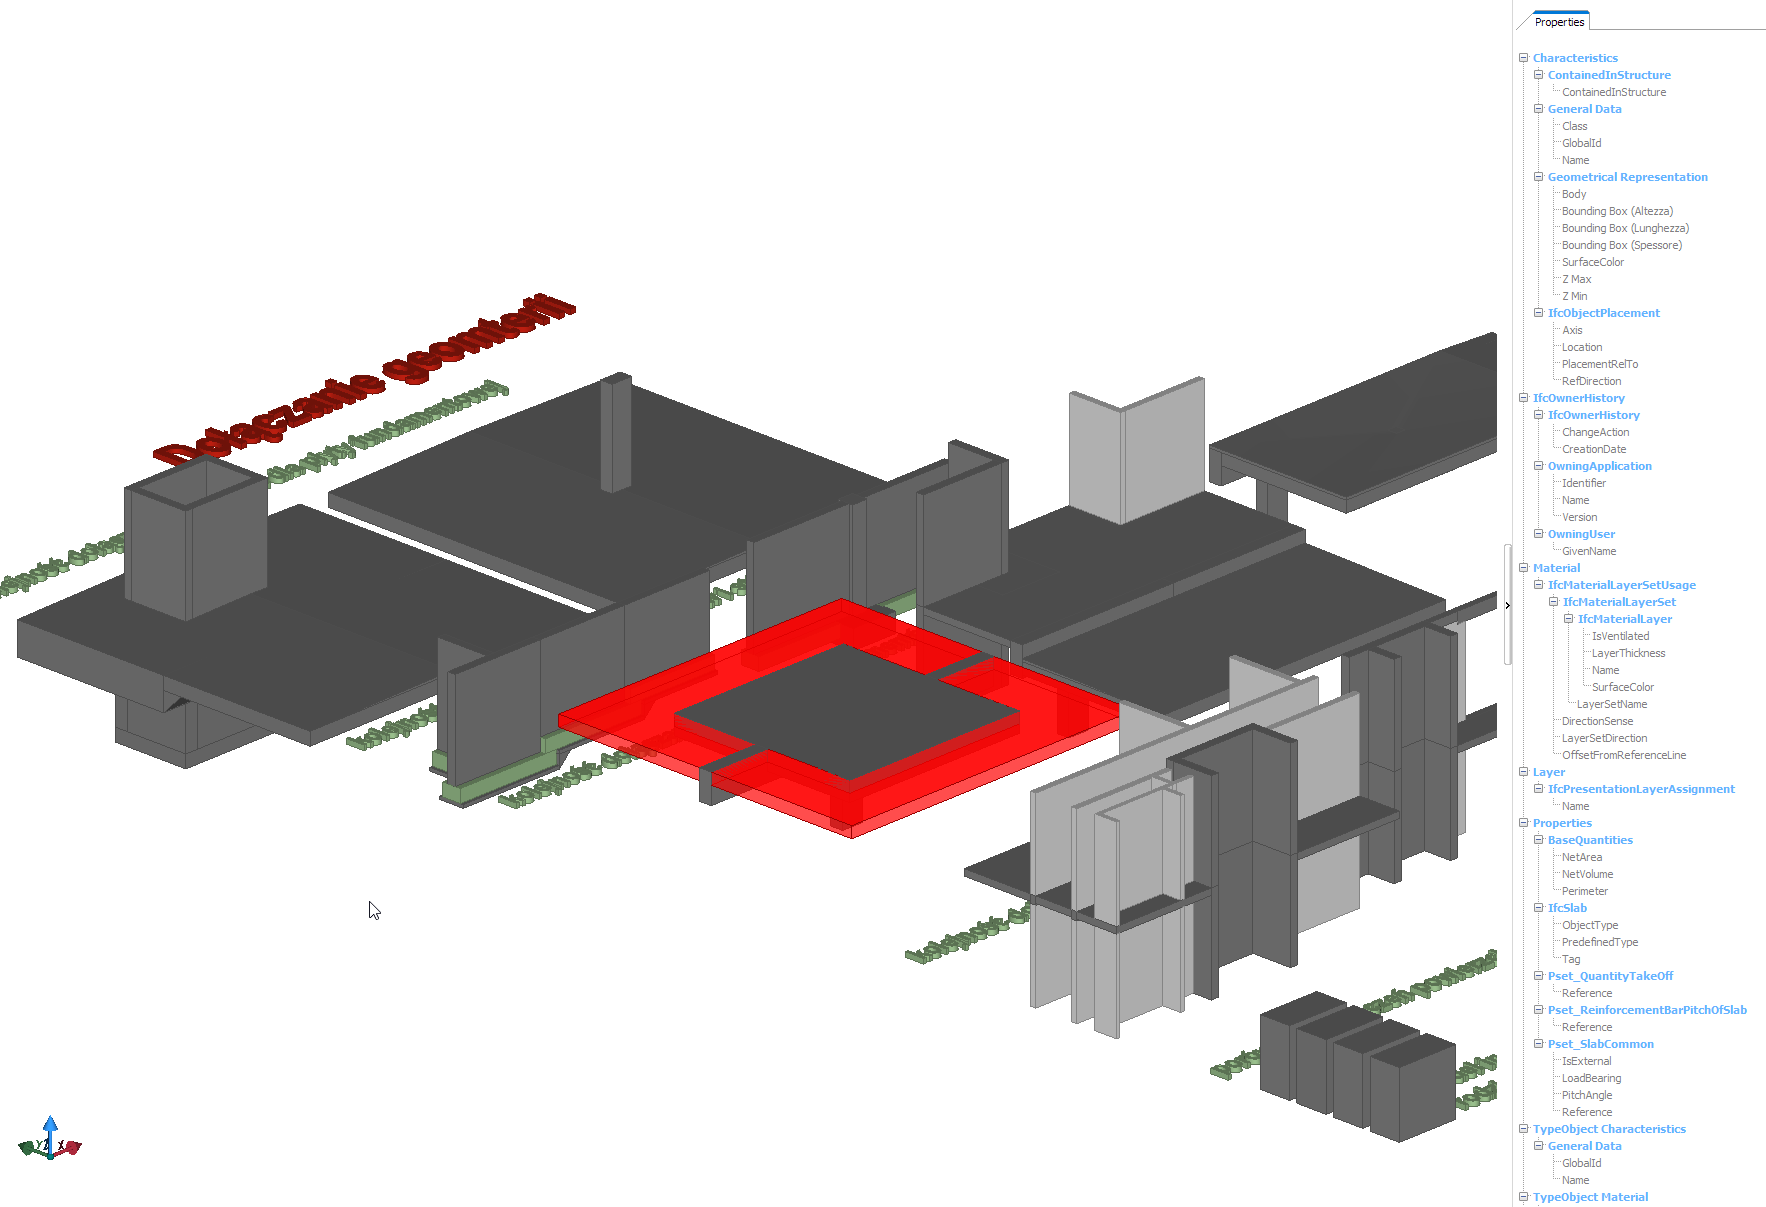
IFC validation in Solibri

IFC Validation — IDS and Python Scripting

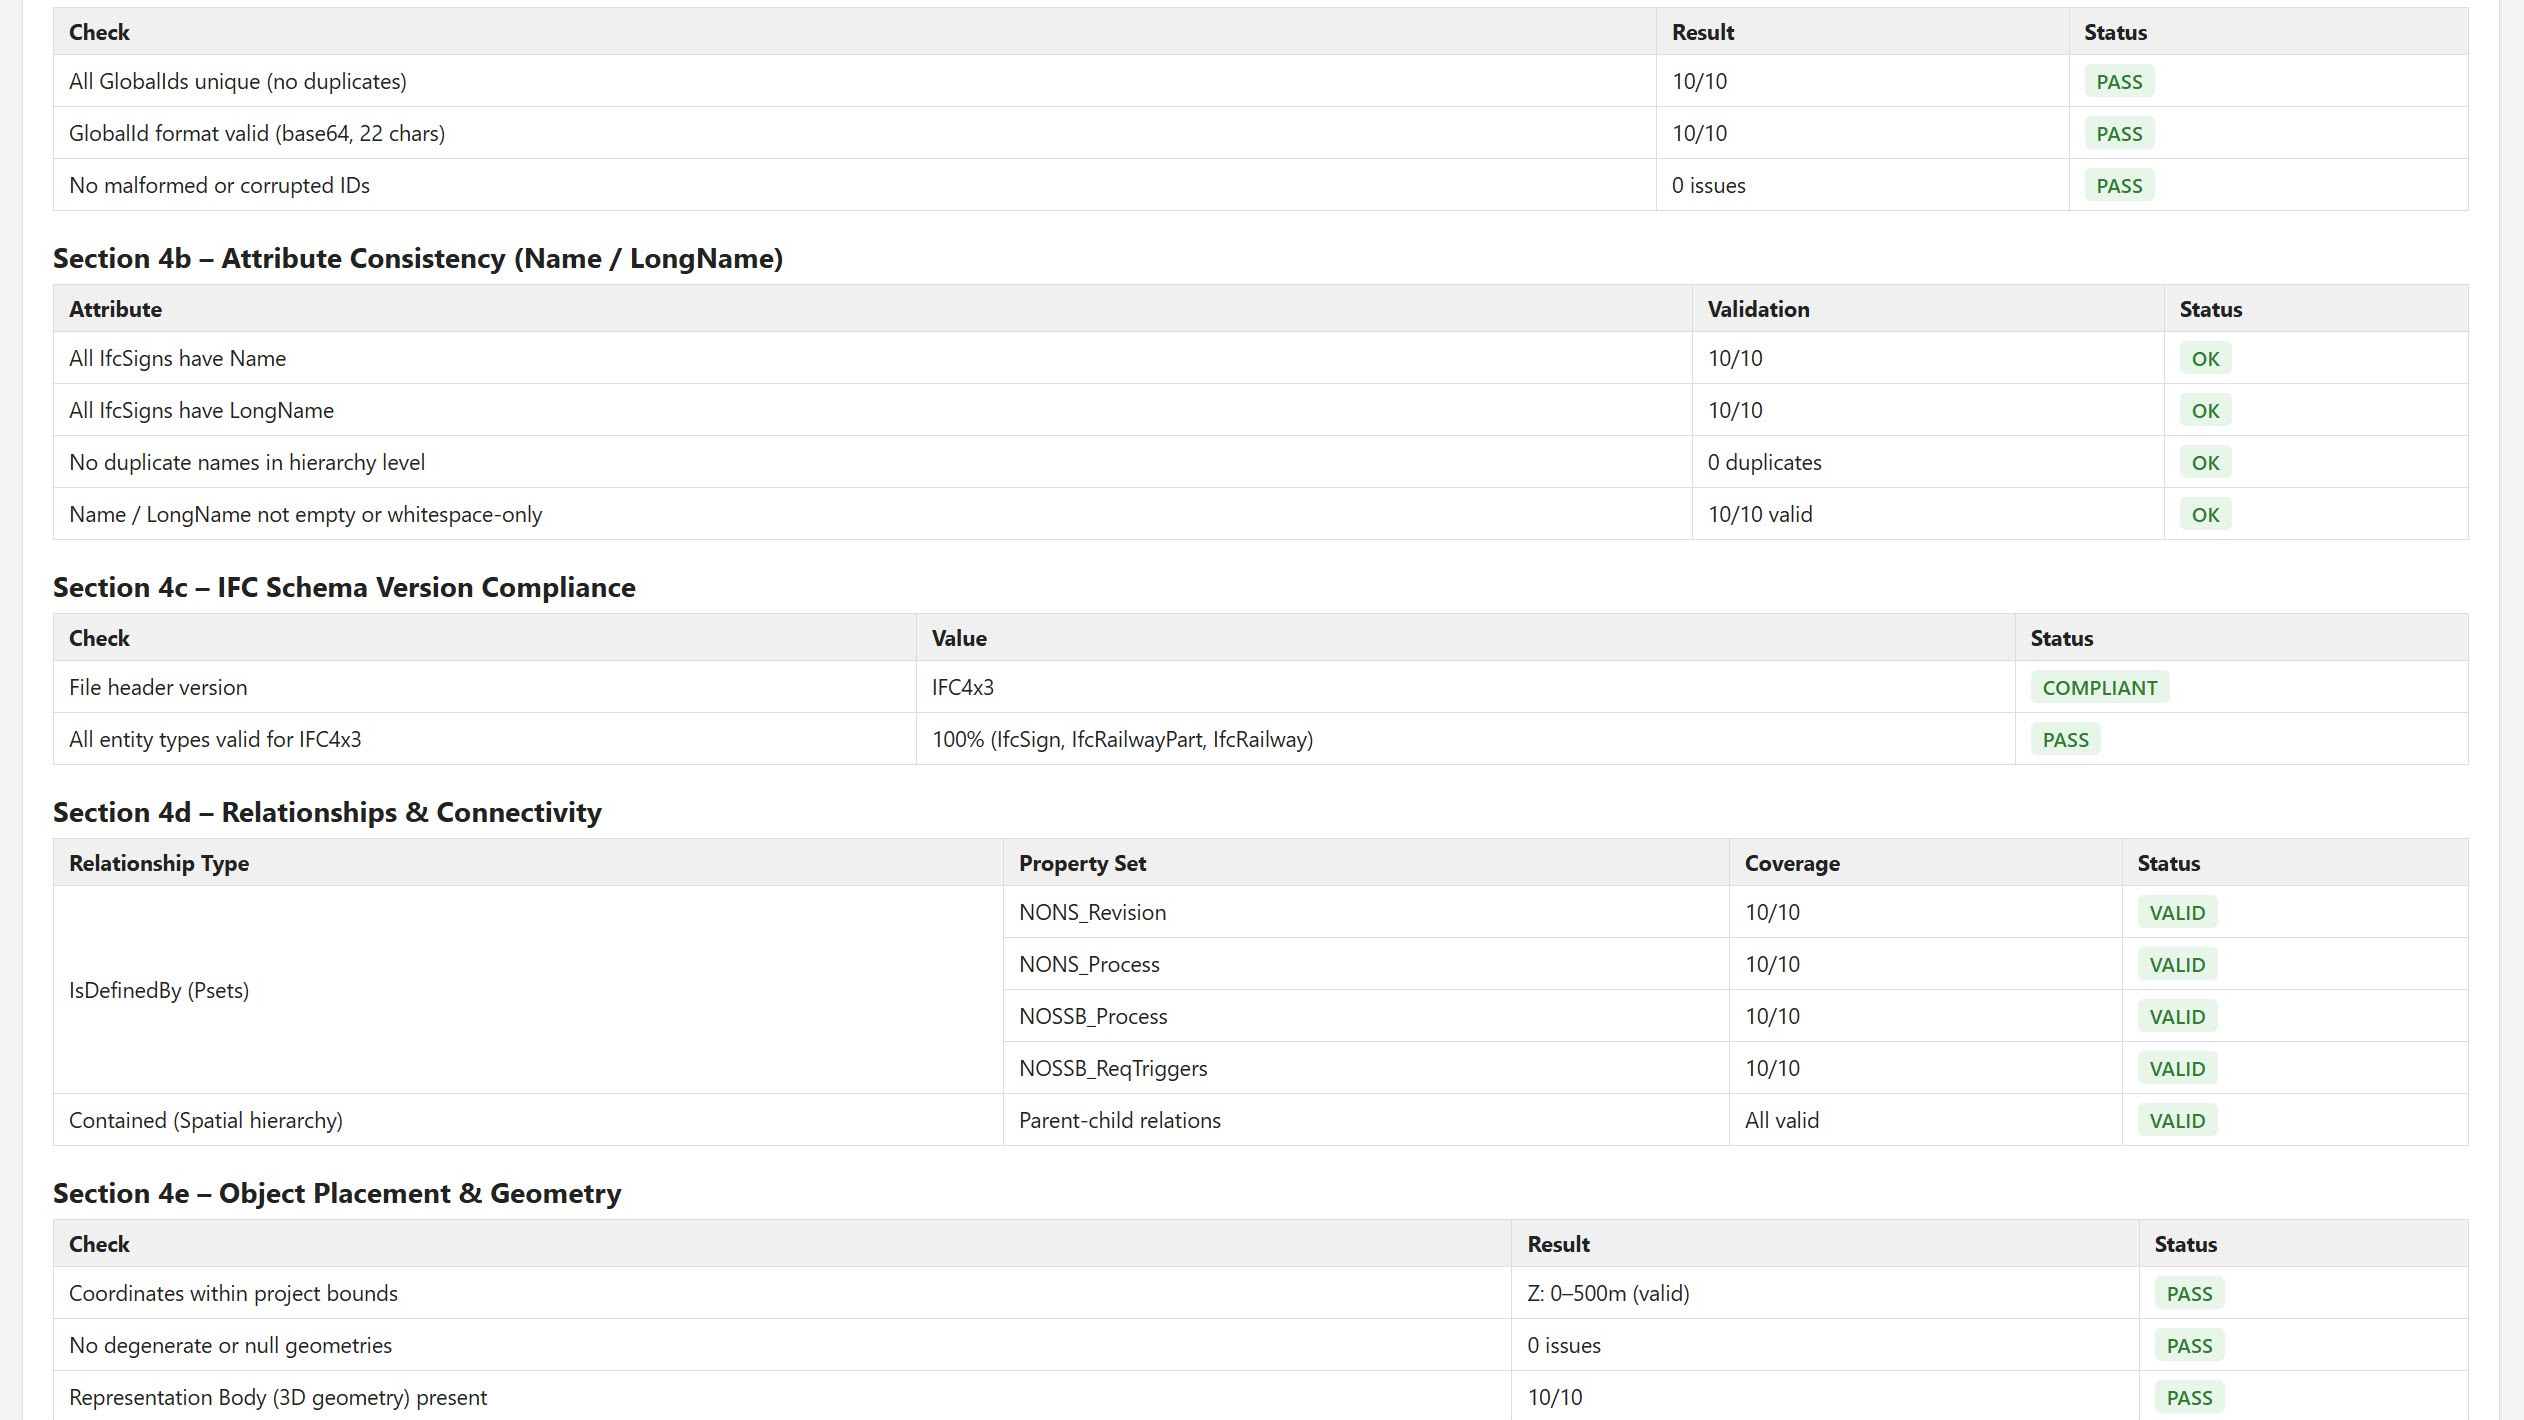
IDS files are used to check client requirements. In tools like Solibri or usBIM, IFC files can be checked with IDS files. The report reveals which values are incorrect and what data the model actually contains. It is a fast and standardized validation format, ready to share with the entire project team. Each designer can independently check whether the property sets in their IFC file are filled in correctly.


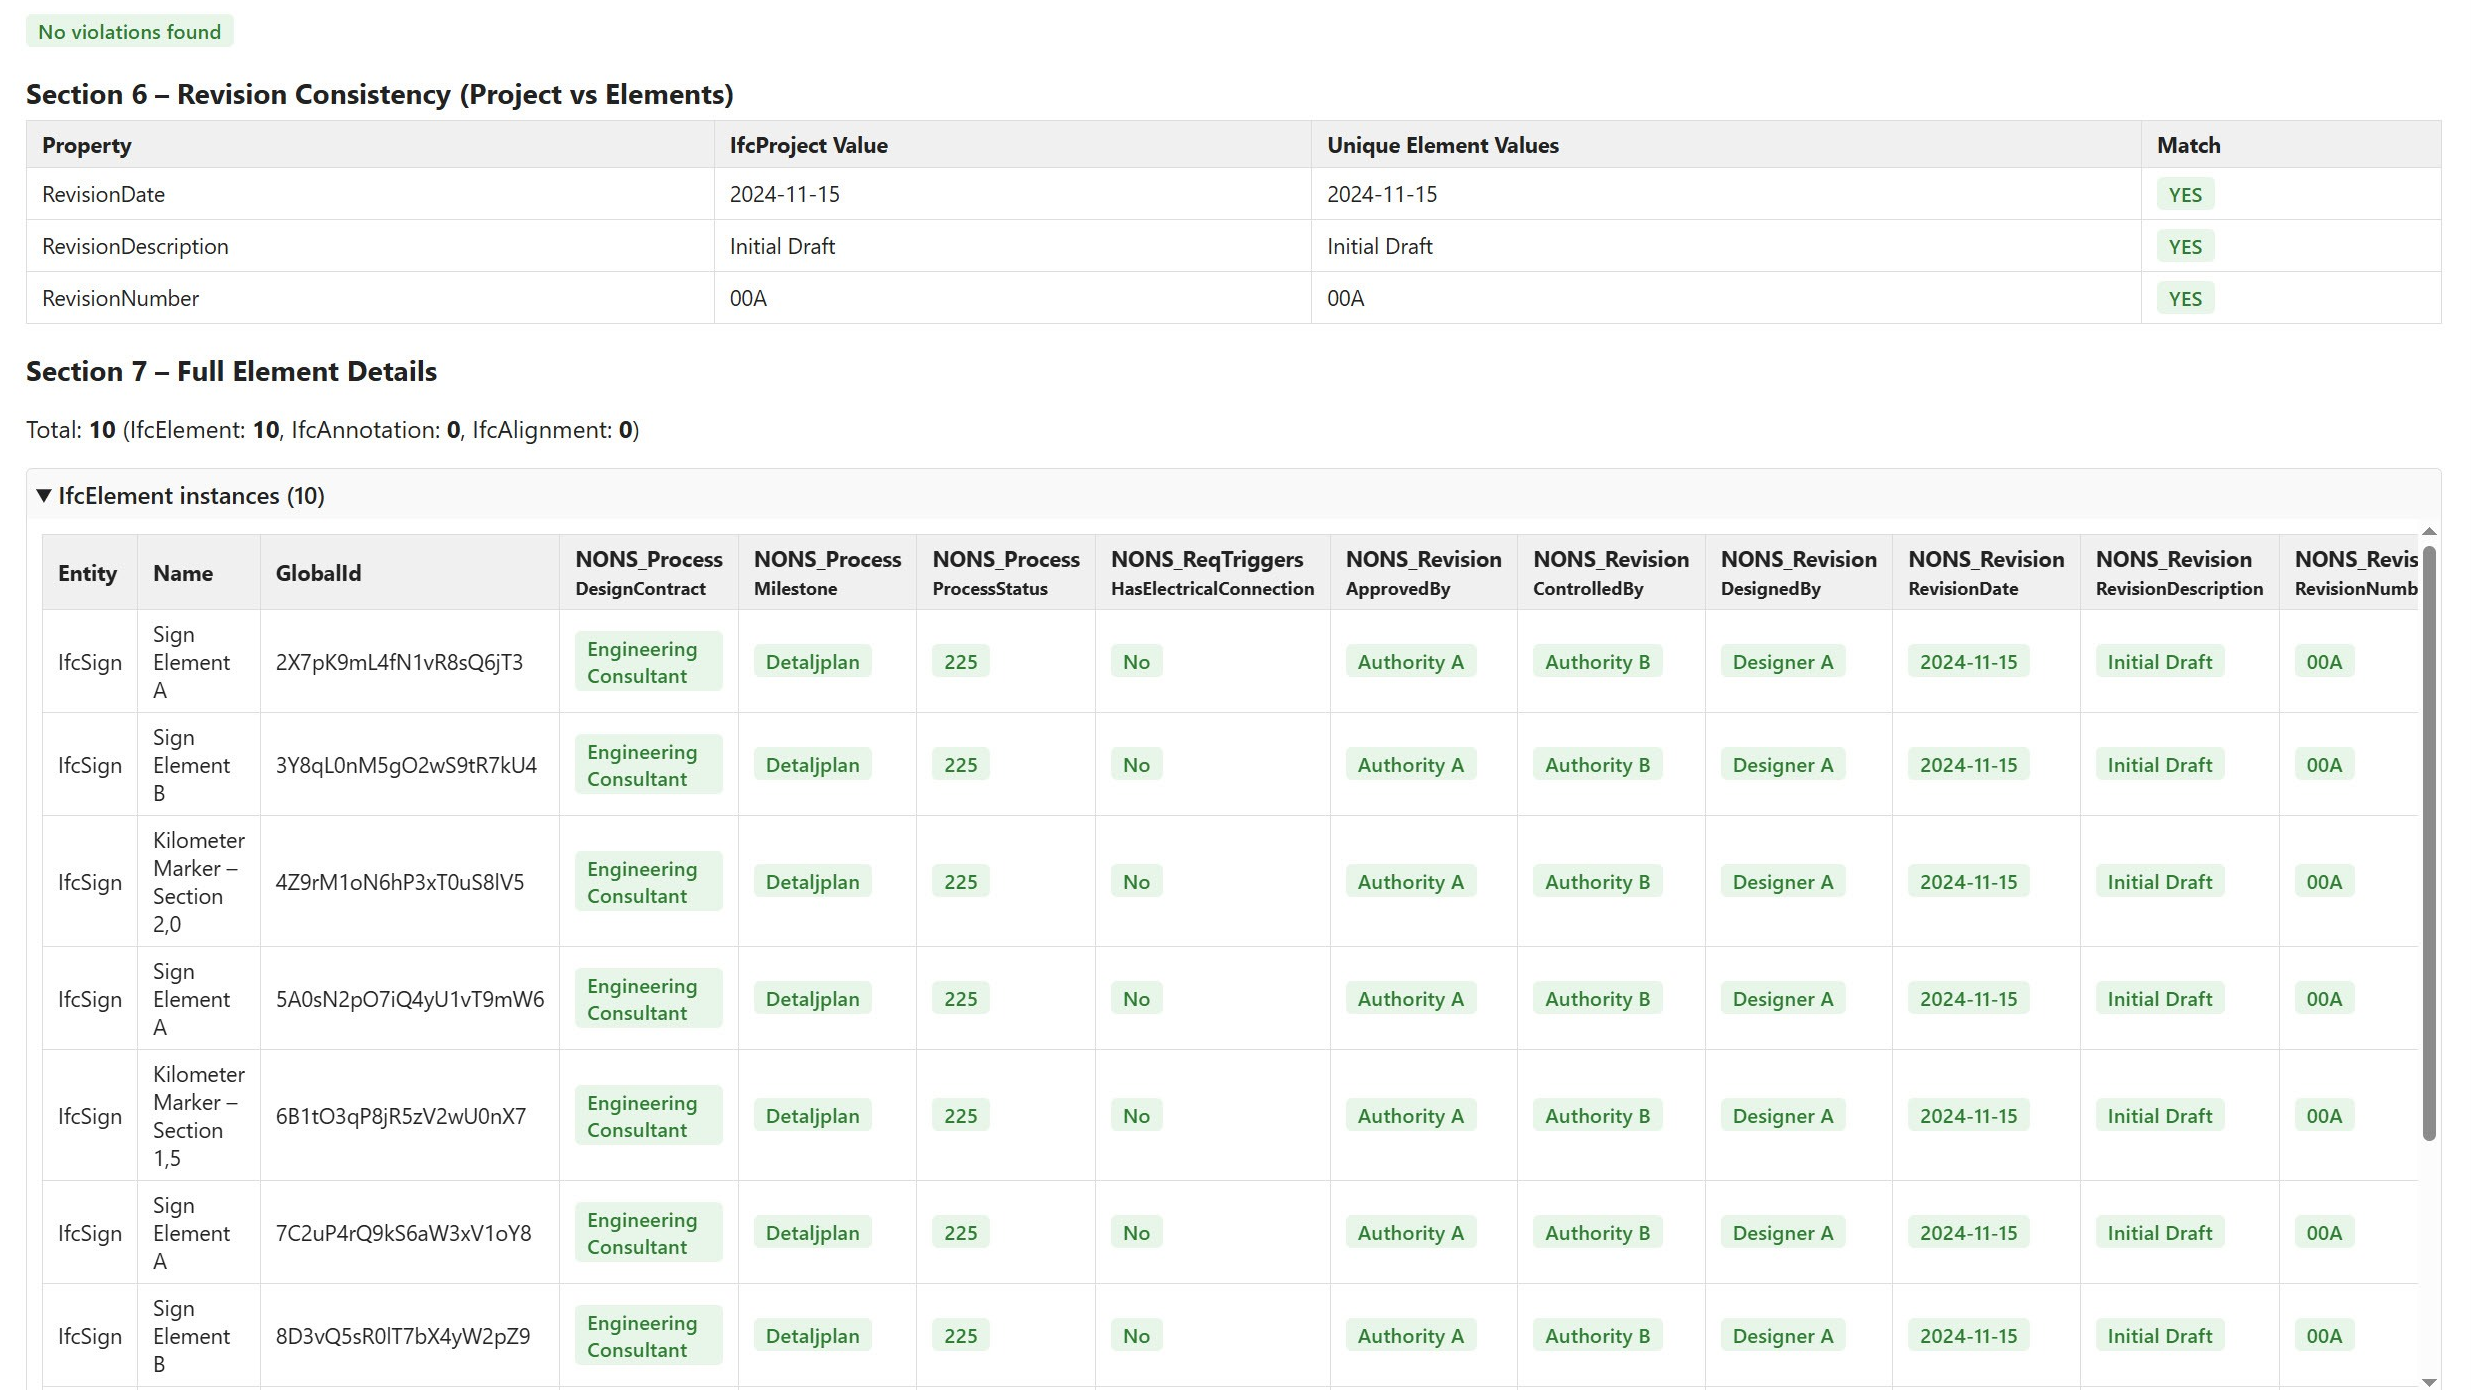
The script gives us more freedom in tailoring how we want to create reports and check IFC files. The code can be adapted to specific needs. For example:

  • checking name and longname values for each entity,
  • verifying MMI values,
  • checking required property sets,
  • revision consistency across the whole file,
  • correctness of object descriptions relative to their type (cable mast, foundation, etc.).

Additionally, through the script we can not only check property sets but also directly fix them without involving the designer. As a result, we get a corrected IFC file, ready for delivery.


IFC IDS Python
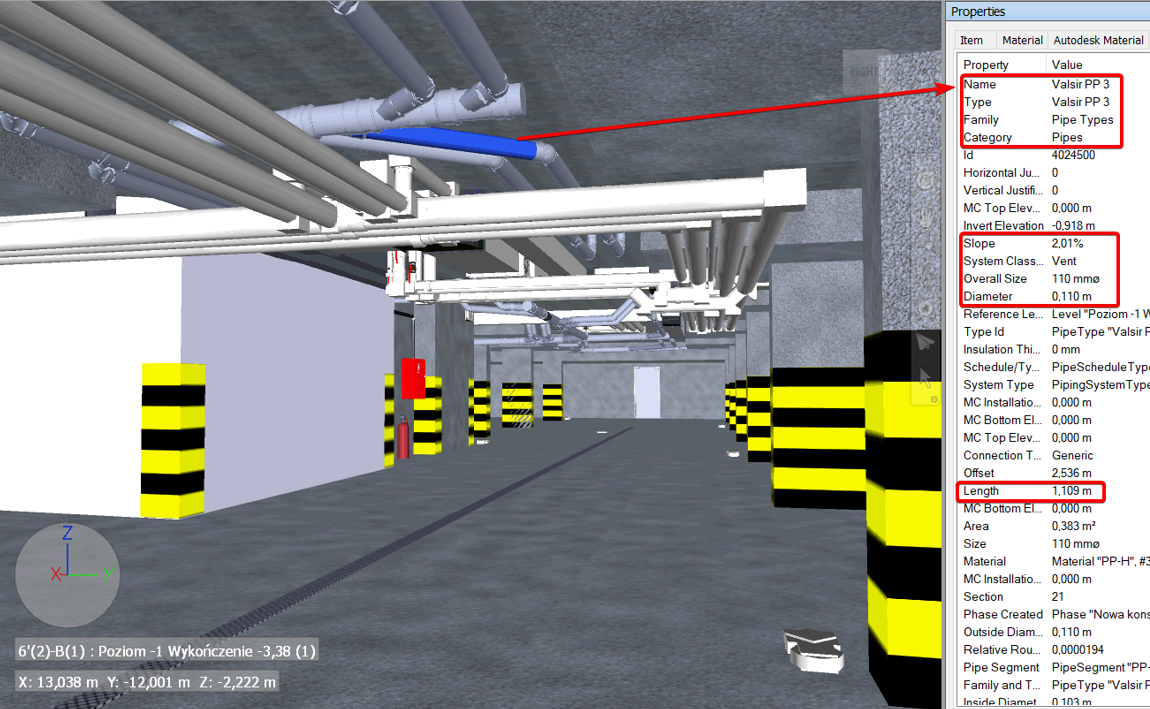
Infrastructure BIM model
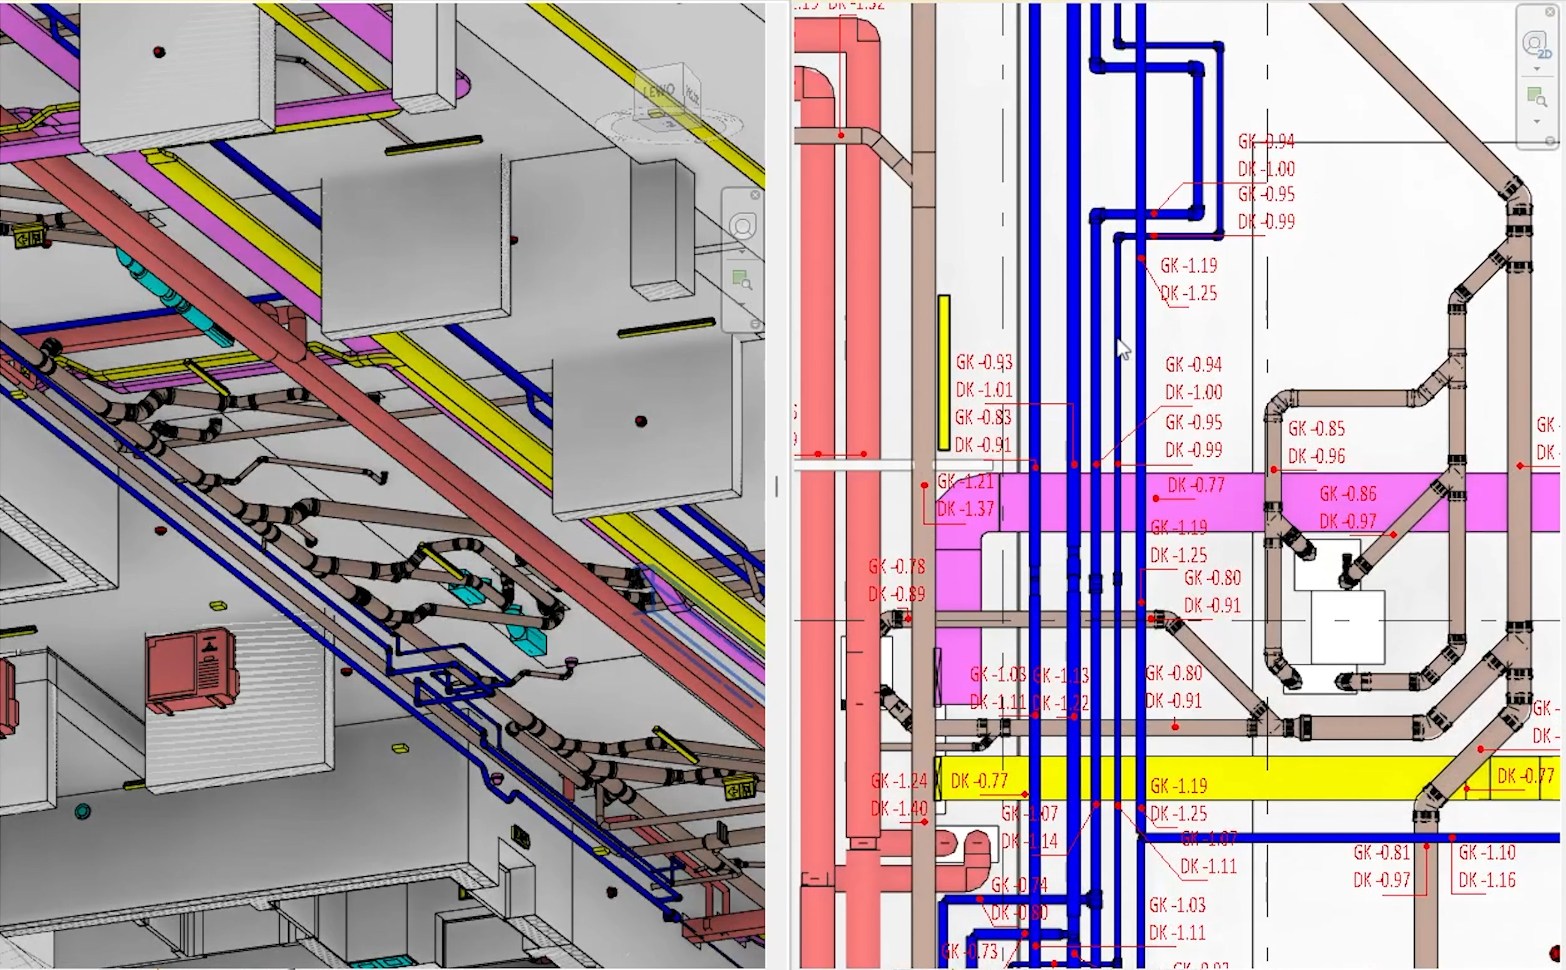
Civil engineering coordination
IFC data exchange

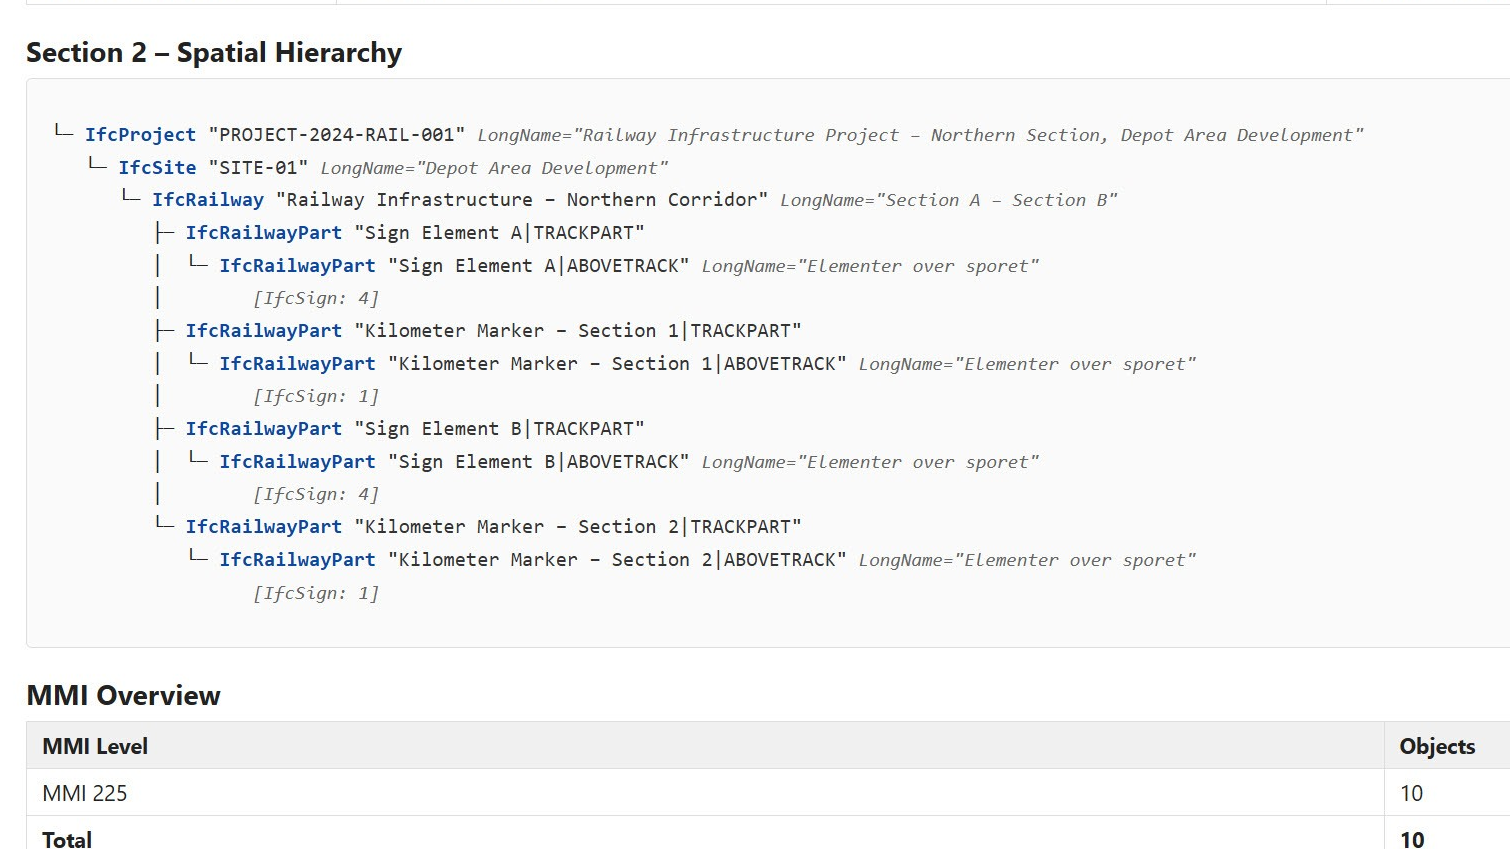
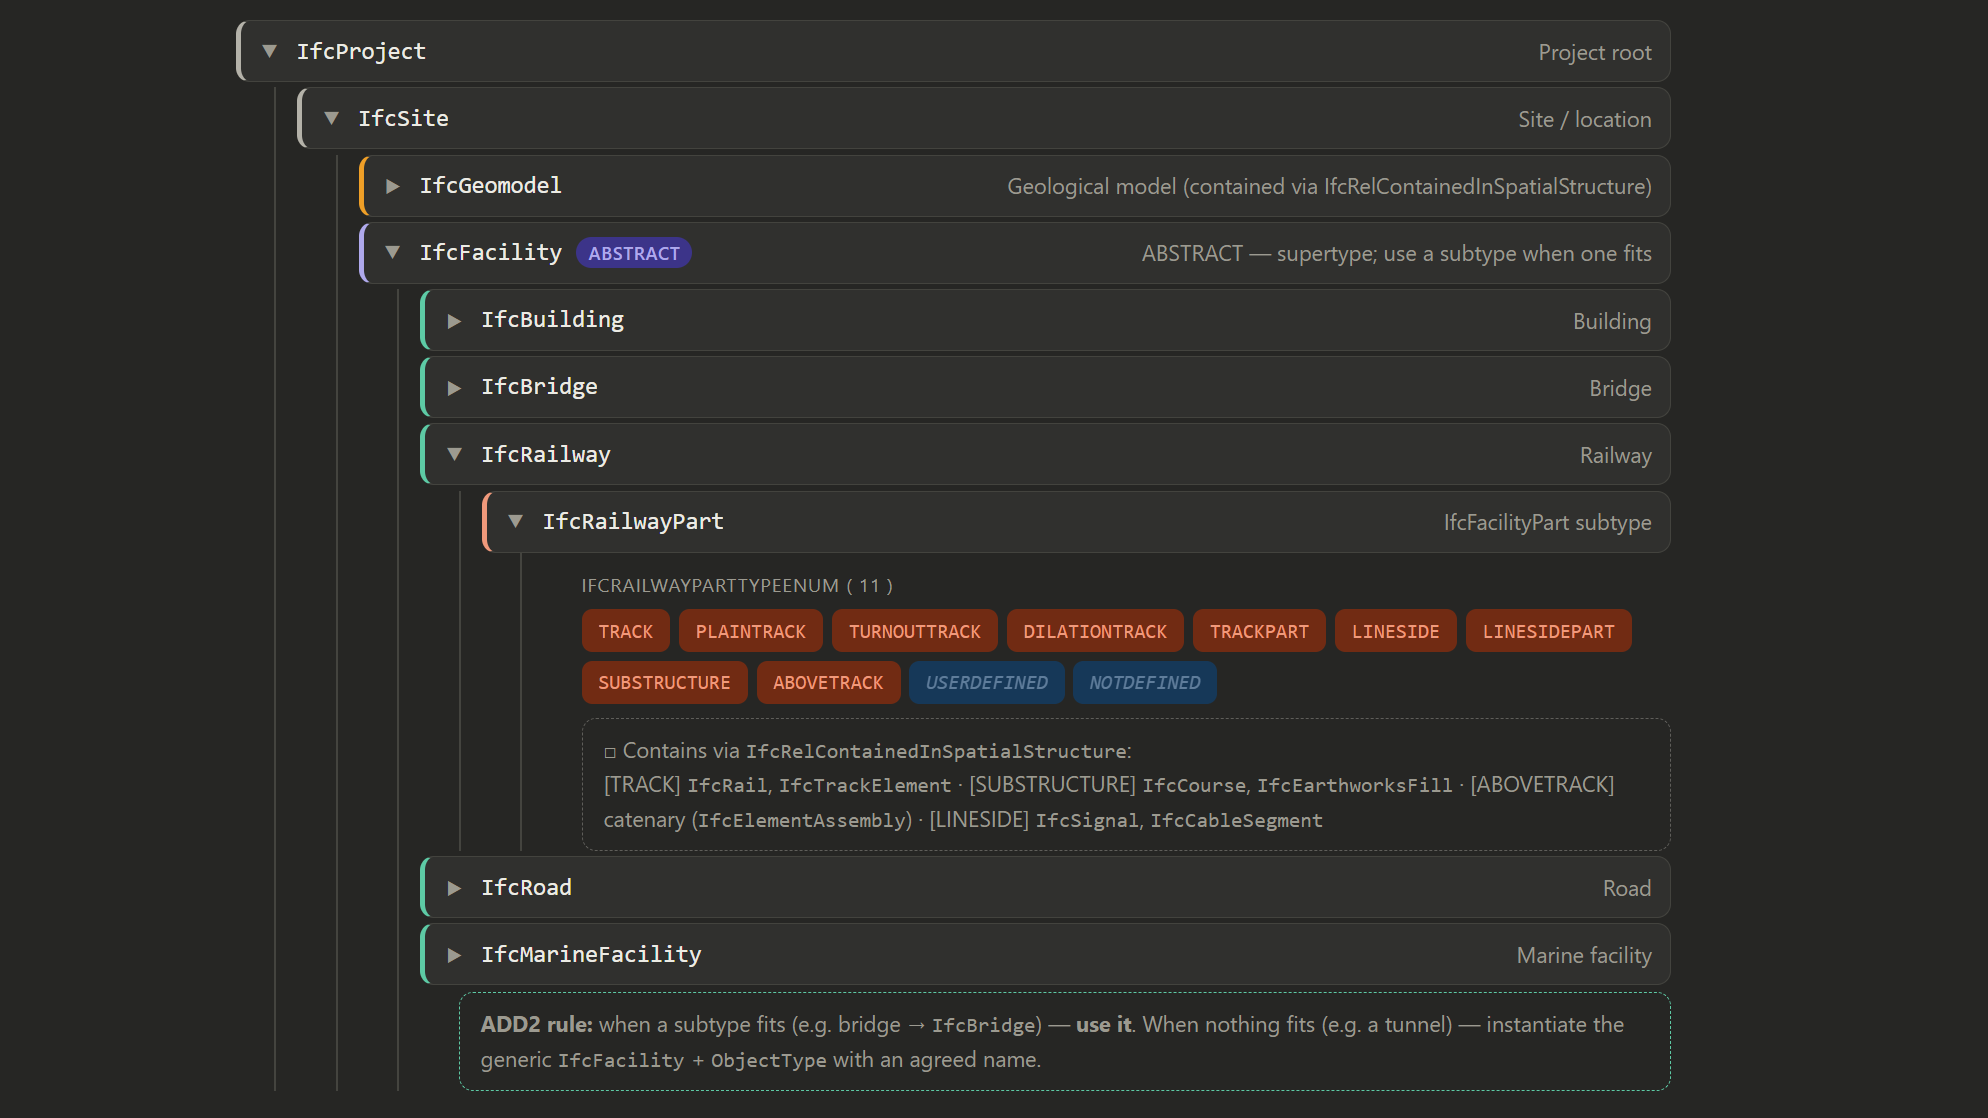
IFC 4x3 in Infrastructure

IFC 4x3 lets us map proper entities connected to infrastructure such as IfcRailway, IfcRailwayPart, IfcSign, IfcRoad, and more. Getting them into the export correctly is another matter.


Civil 3D and Novapoint handle the same standard differently. Object mapping, conversion rule files, spatial hierarchy that actually lands as a correct representation of buildingSMART or the client's standard.


IFC Python
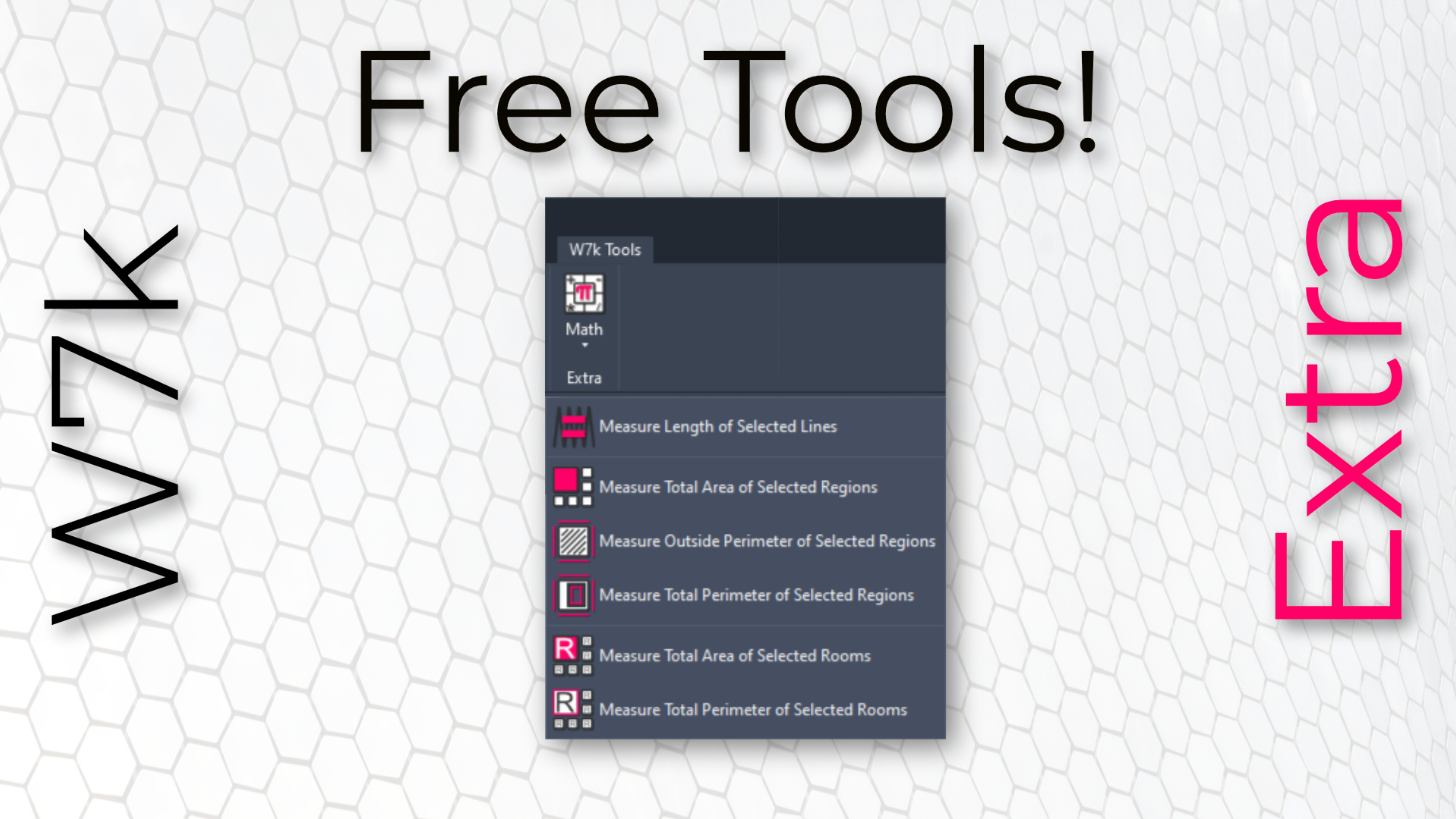
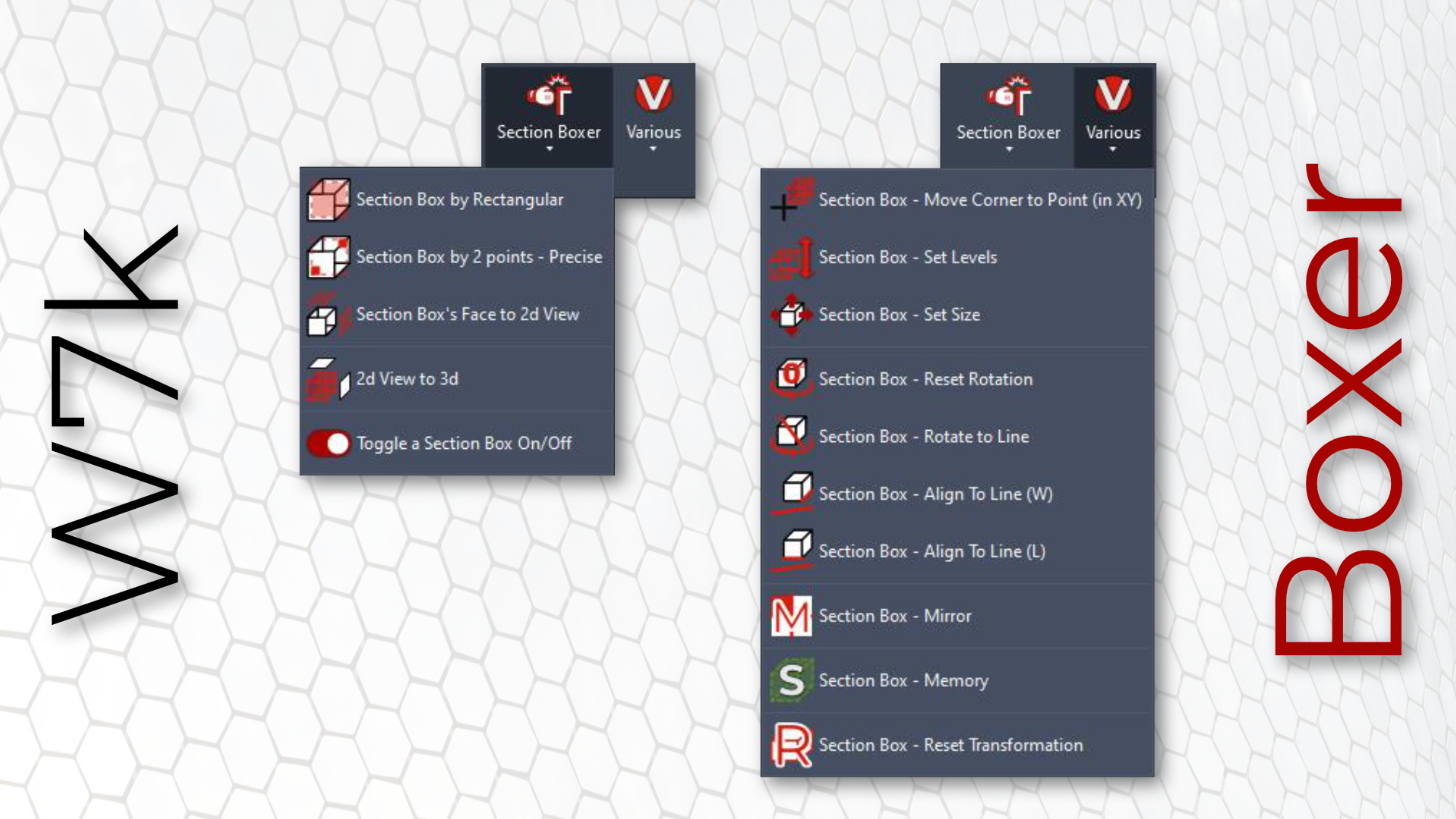
Revit C# add-ins: Drafter, Leveler, Boxer, Extra
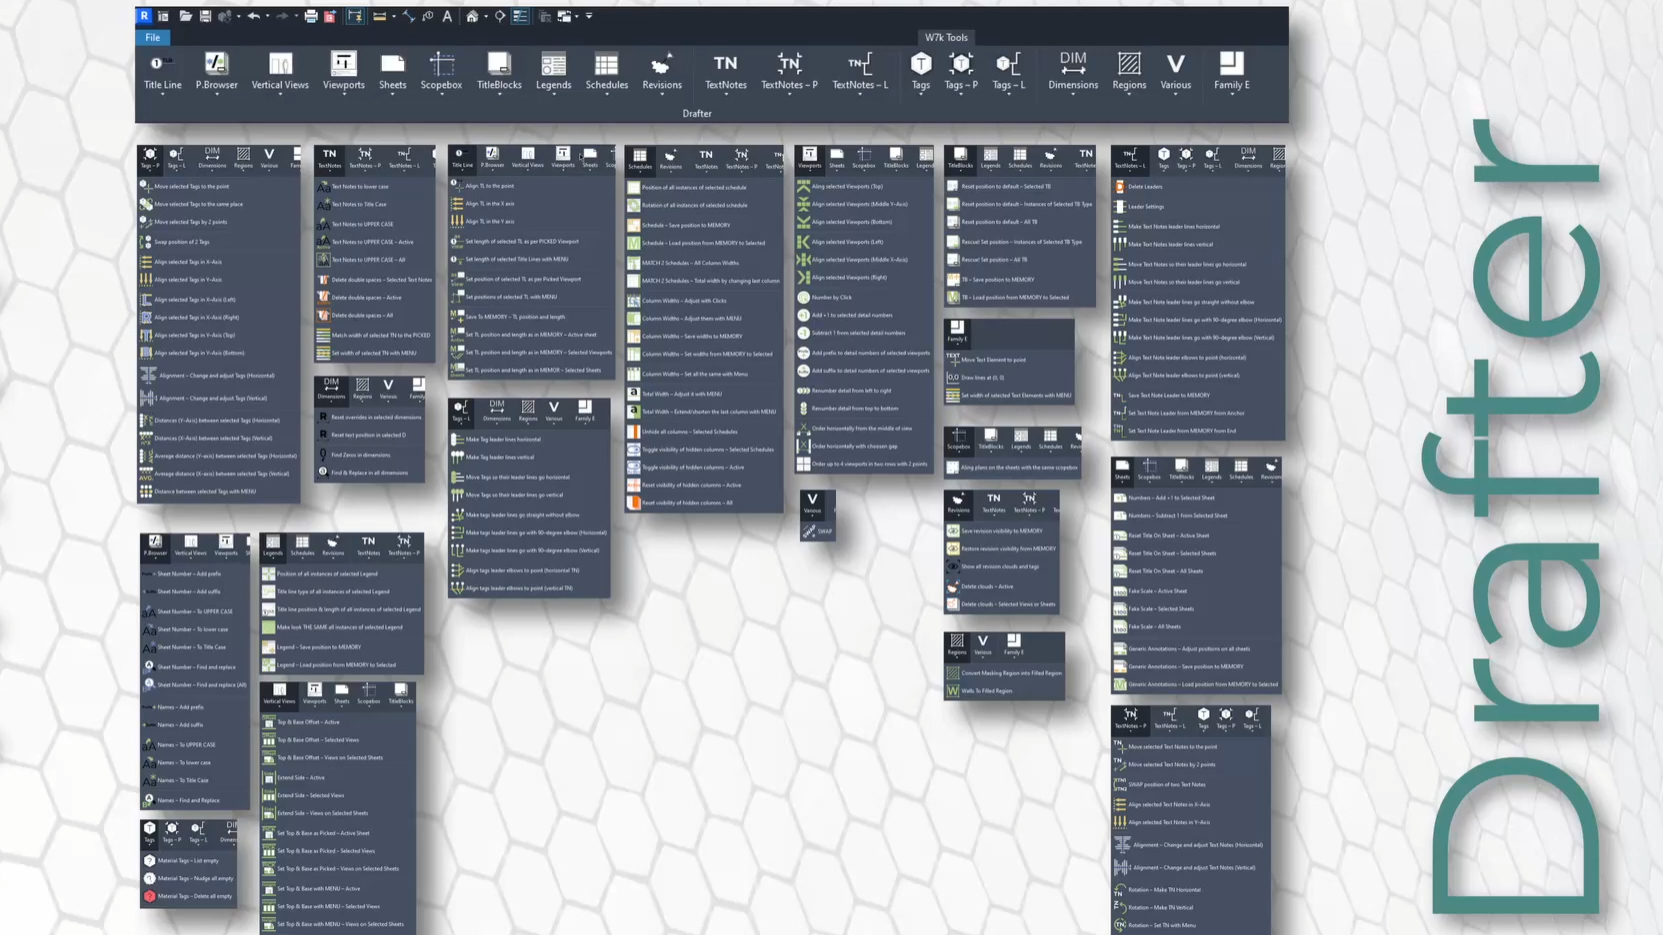
Drafter add-in ribbon and tools
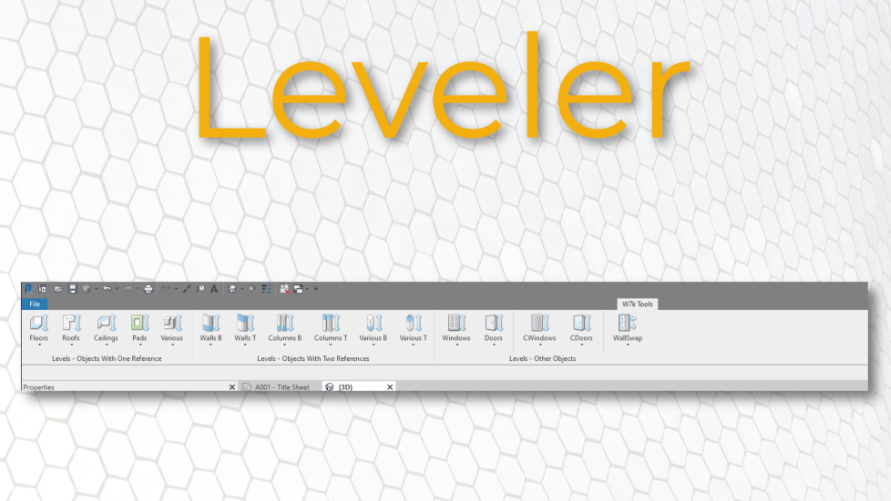
Leveler and Boxer automation examples
Revit drawing automation in action

Revit & C# journey: Drafter, Leveler, Boxer & Extra

The game-changer for my daily work as an architect. For fast and handy access to simple yet powerful options available with the Revit API, C# is the right solution. Where Dynamo Player requires a step-by-step script, object-oriented programming with direct access in the Revit ribbon is marvellous. One click, immediate and repeatable result, no intermediate steps required — and Revit's functionality expands beyond the software developer's roadmap. This is why I definitely recommend you give it a shot.

Across the four tools I published, each targets a specific friction point in daily Revit work.

  • Drafter covers drawing consistency and annotation with around 180 automations.
  • Leveler handles level and elevation-based operations.
  • Boxer focuses on element bounding and grouping.
  • Extra concentrates on maths operations and will help with measuring elements.


All four are live on the Autodesk App Store and used by architects and engineers worldwide. Experience gathered through the process allows me to share tips for both experienced and beginner coders, and also to point out tricky solutions and Revit usage beyond classic design. Check them on my blog!

Autodesk Revit C# Visual Studio Visual Studio Code

Notice: All software logos, trade names, trademarks, and data exchange format marks displayed on this website are the property of their respective owners. They are used solely for informational and referential purposes, to indicate the tools utilized in the presented professional activities. Their use does not constitute official use of the manufacturers’ materials, nor does it imply any affiliation, sponsorship, partnership, or endorsement by the respective trademark owners.